
- PREMIUM
- LIVE QUOTES
- INSTITUTION
 Index Options
 State Street
 CME Group
 Nasdaq
 Cboe
Cboe TradingView
 Wall Street Journal
Is BlackBerry A Value Opportunity After Recent Cybersecurity Pivot And Share Price Rebound?
- If you are wondering whether BlackBerry is quietly turning into a value opportunity after years in the wilderness, this piece will walk through whether the current share price still leaves upside on the table.
- The stock has had a choppy ride, up 7.9% over the last week and 11.1% year to date. That sits alongside a 54.2% gain over the past year and a still hefty 42.0% decline over five years.
- Recently, investors have been refocusing on BlackBerry’s pivot toward cybersecurity software and automotive embedded systems as it continues to distance itself from its legacy handset days. Those strategic updates, partnerships, and product developments have helped shape shifting expectations around the company’s long term growth path and risk profile.
- Right now, BlackBerry scores just 2/6 on our valuation checks, so we will break down what different valuation approaches say about the stock today, then finish with a more holistic way to make sense of that valuation story.
BlackBerry scores just 2/6 on our valuation checks. See what other red flags we found in the full valuation breakdown.
Approach 1: BlackBerry Discounted Cash Flow (DCF) Analysis
A Discounted Cash Flow model estimates what a company is worth today by projecting the cash it could generate in the future and discounting those cash flows back to their value in today’s dollars.
BlackBerry currently generates about $17.3 Million in free cash flow. Analyst and model projections anticipate a sharp ramp up, with free cash flow expected to reach roughly $35.7 Million by 2026 and $1.23 Billion by 2035. The next few years are guided by analyst estimates, while later years are extrapolated by Simply Wall St using the company’s recent growth profile and industry dynamics.
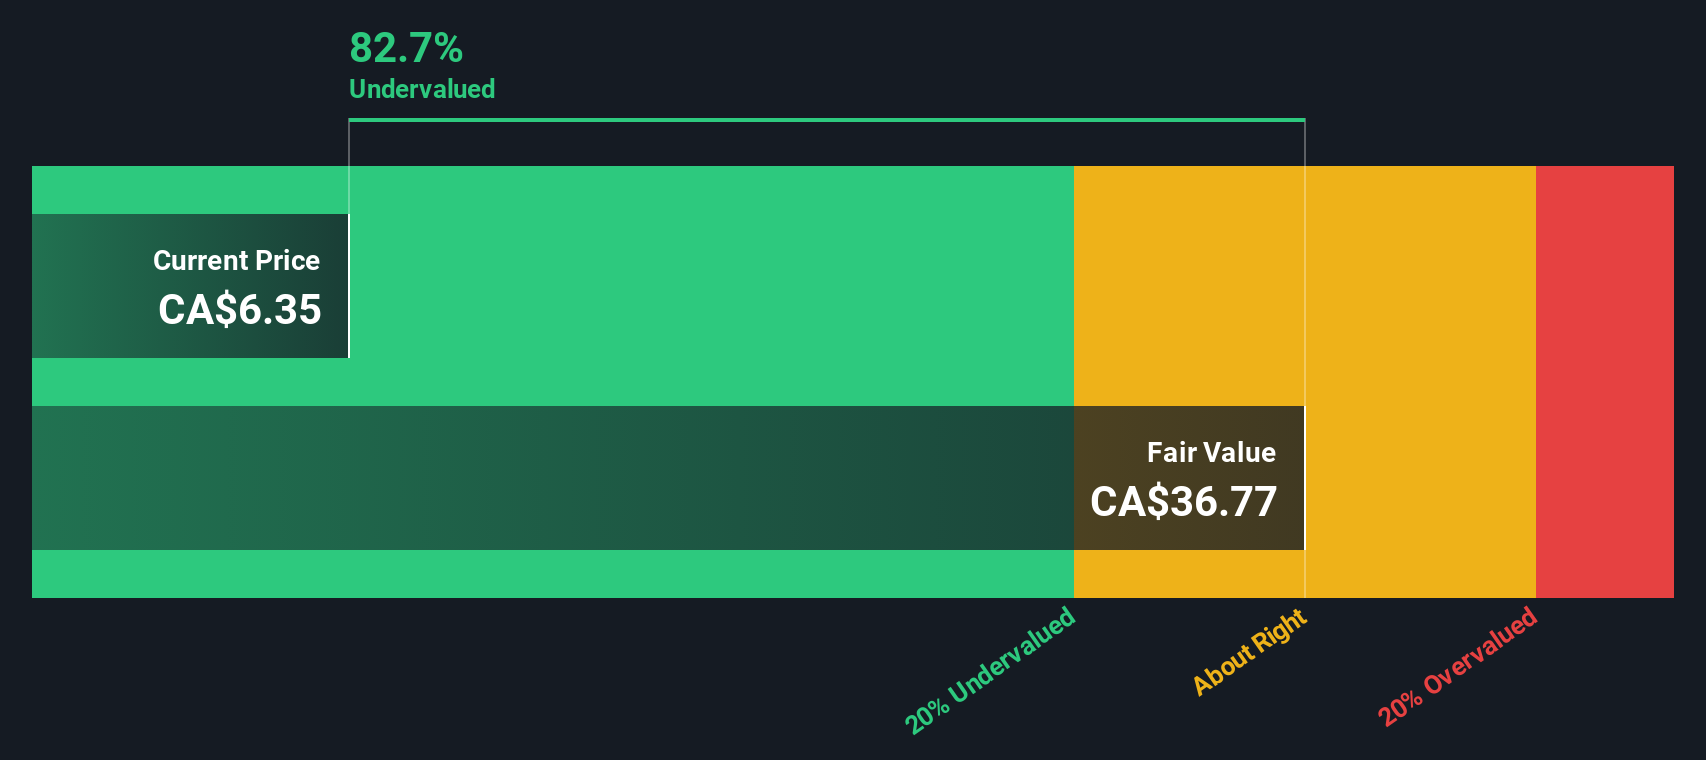
Rolling all of those projections into a 2 Stage Free Cash Flow to Equity model results in an estimated intrinsic value of about $37.19 per share. Compared with the current share price, the DCF indicates an implied discount of roughly 83.5%. On cash flow grounds, this suggests that the market might be pricing BlackBerry far below its long term earnings potential.
Result: UNDERVALUED
Our Discounted Cash Flow (DCF) analysis suggests BlackBerry is undervalued by 83.5%. Track this in your watchlist or portfolio, or discover 903 more undervalued stocks based on cash flows.
Approach 2: BlackBerry Price vs Earnings
For companies that are at, or moving toward, sustainable profitability, the Price to Earnings (PE) ratio is a useful way to judge how much investors are paying for each dollar of profit. A higher PE can be justified when a company has strong, visible growth ahead and relatively lower risk, while slower growing or riskier businesses usually warrant a lower multiple.
BlackBerry currently trades at about 132.4x earnings, which is well above both the broader Software industry average of roughly 52.3x and the peer group average of around 68.3x. On those simple comparisons, the stock screens as expensive. However, Simply Wall St’s proprietary Fair Ratio framework goes a step further by asking what PE multiple BlackBerry should trade on, given its specific earnings growth outlook, profitability profile, risk factors, industry positioning and market cap.
That Fair Ratio for BlackBerry is 36.8x, materially below the current 132.4x multiple. Because this metric adjusts for growth and risk rather than just comparing to broad industry or peer averages, it offers a more tailored view of value and suggests that, on an earnings basis alone, the shares are priced well above what looks justified.
Result: OVERVALUED

PE ratios tell one story, but what if the real opportunity lies elsewhere? Discover 1450 companies where insiders are betting big on explosive growth.
Upgrade Your Decision Making: Choose your BlackBerry Narrative
Earlier we mentioned that there is an even better way to understand valuation, so let us introduce you to Narratives, a simple framework that lets you describe your view of a company with a story behind the numbers, including your assumptions for fair value and future revenue, earnings and margins. A Narrative ties three pieces together: what you believe about the business, how that belief translates into a financial forecast, and what fair value that forecast implies. On Simply Wall St, millions of investors use Narratives on the Community page as an easy, accessible tool to decide when to buy or sell by comparing their Narrative Fair Value to the current share price, then watching those Narratives update dynamically as new information, such as news or quarterly results, is released. For BlackBerry, for example, one investor might build a Narrative that expects rapid cybersecurity growth and much higher margins, leading to a far higher fair value, while another assumes slower adoption and more modest profitability, resulting in a far lower fair value and a very different decision on whether the stock looks attractive today.
Do you think there's more to the story for BlackBerry? Head over to our Community to see what others are saying!

This article by Simply Wall St is general in nature. We provide commentary based on historical data and analyst forecasts only using an unbiased methodology and our articles are not intended to be financial advice. It does not constitute a recommendation to buy or sell any stock, and does not take account of your objectives, or your financial situation. We aim to bring you long-term focused analysis driven by fundamental data. Note that our analysis may not factor in the latest price-sensitive company announcements or qualitative material. Simply Wall St has no position in any stocks mentioned.
Have feedback on this article? Concerned about the content? Get in touch with us directly. Alternatively, email editorial-team@simplywallst.com