
- PREMIUM
- LIVE QUOTES
- INSTITUTION
 Index Options
 State Street
 CME Group
 Nasdaq
 Cboe
Cboe TradingView
 Wall Street Journal
Is Tempus AI Still Attractive After Its 121.5% Surge and AI Healthcare Momentum in 2025?
- If you have been wondering whether Tempus AI's rapid rise is justified or if the stock is already priced for perfection, you are not alone.
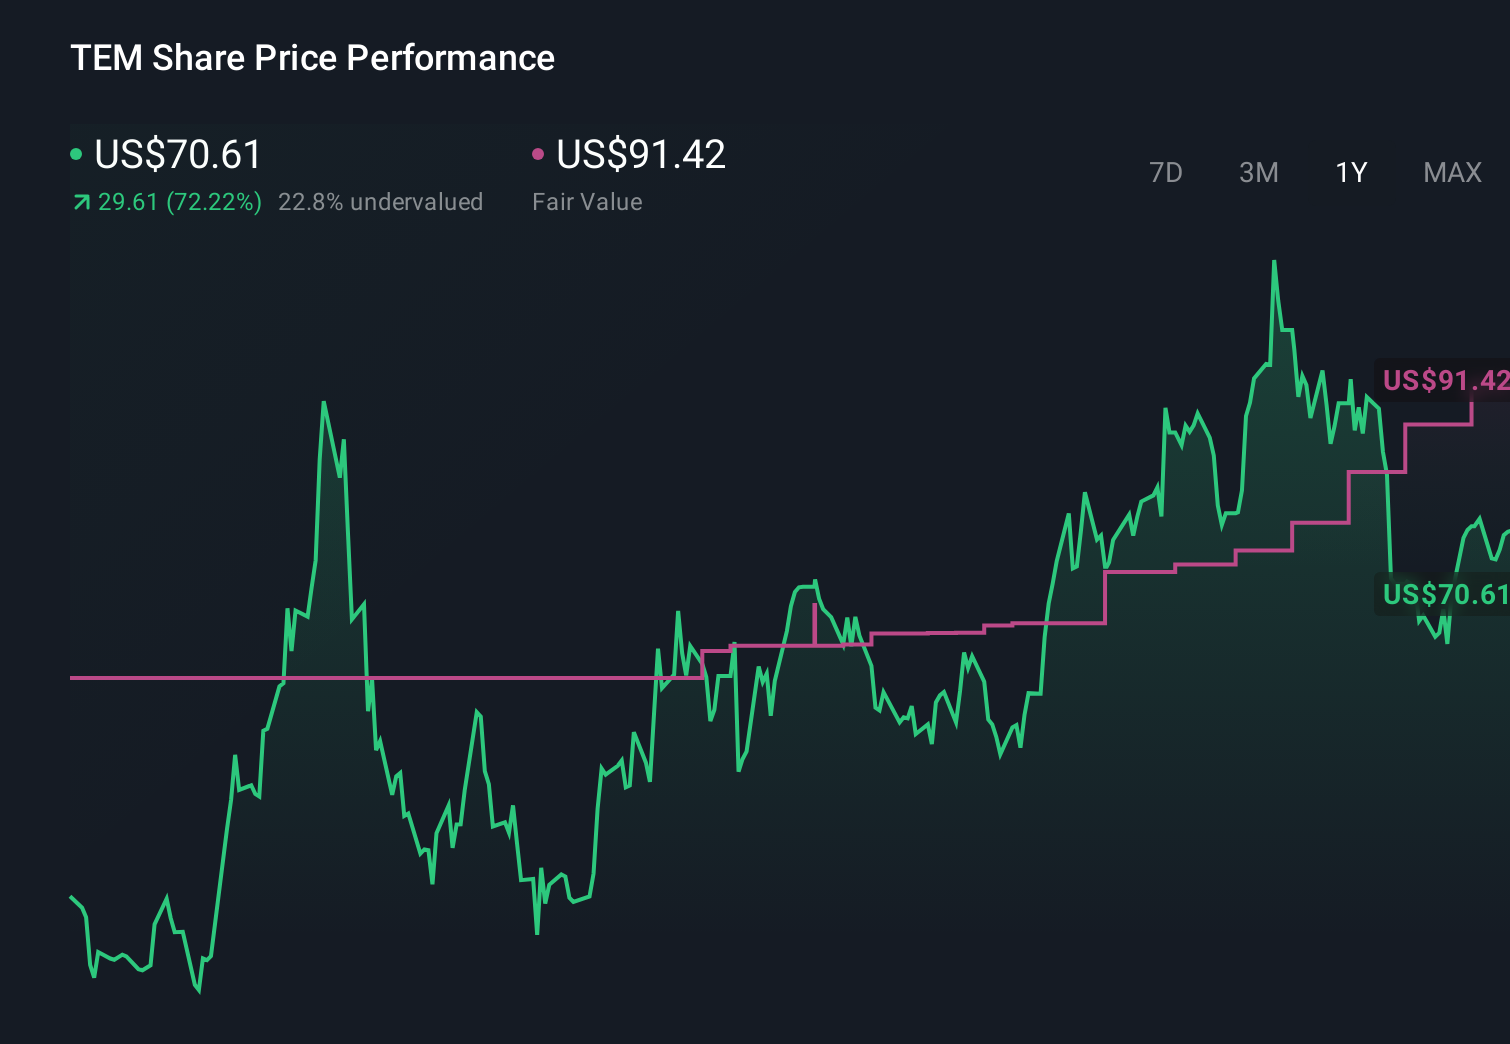
- After a strong run, the stock is still up 121.5% year to date, including a 6.0% gain over the last month and 2.6% over the past week. This suggests that sentiment is anything but neutral.
- Much of this excitement has been driven by Tempus AI's expanding role in applying AI to precision medicine and data driven clinical decision support, which investors see as a massive long term opportunity. Announcements around new healthcare partnerships and broader adoption of its platform have reinforced the narrative that Tempus could become a key infrastructure player in AI powered diagnostics.
- Even with all that momentum, Tempus AI currently scores a 3/6 valuation check score. This suggests it looks undervalued on some measures and less so on others. We will unpack this using multiple valuation approaches, before finishing with a more intuitive way to think about what the stock might really be worth.
Approach 1: Tempus AI Discounted Cash Flow (DCF) Analysis
A Discounted Cash Flow model estimates what a company is worth by projecting all the cash it could generate in the future and then discounting those cash flows back to today in dollar terms.
For Tempus AI, the 2 Stage Free Cash Flow to Equity model starts from last twelve months free cash flow of about $257.7 million outflow, reflecting a business still in heavy investment mode. Analysts provide early year estimates, and Simply Wall St extrapolates beyond that, with projected free cash flow rising to roughly $2.1 billion by 2035 as the platform scales.
When all these forecast cash flows are discounted back, the model arrives at an intrinsic value of about $153.23 per share. This implies the stock is trading at roughly a 50.5% discount to its estimated fair value, and the current price reflects a more muted long term trajectory than the cash flow projections assume.
Result: UNDERVALUED
Our Discounted Cash Flow (DCF) analysis suggests Tempus AI is undervalued by 50.5%. Track this in your watchlist or portfolio, or discover 903 more undervalued stocks based on cash flows.
Approach 2: Tempus AI Price vs Sales
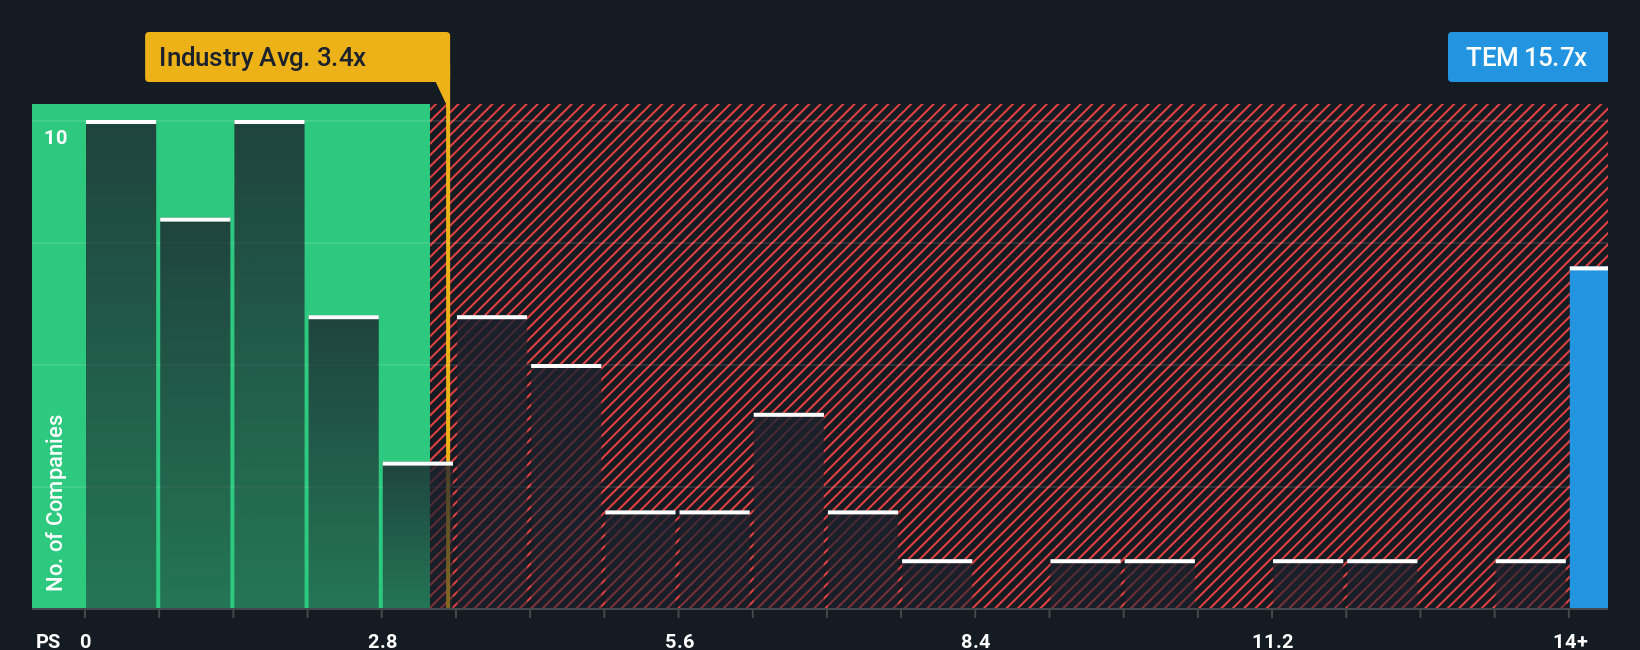
For high growth, not yet profitable companies like Tempus AI, the price to sales ratio is often the cleanest way to compare valuation because it focuses on revenue traction rather than current earnings, which can be distorted by heavy investment.
Investors usually accept a higher price to sales multiple when they expect faster growth and see lower risk, while slower or more uncertain growth typically justifies a lower, more conservative multiple. Tempus AI currently trades on a price to sales ratio of about 12.21x, which is well above the Life Sciences industry average of 3.38x and also higher than the peer group average of 4.93x. This signals that the market already prices in strong growth and a strategic edge.
Simply Wall St’s Fair Ratio framework estimates that, given Tempus AI’s growth profile, margins, market cap, industry and specific risks, a more appropriate multiple would be around 8.78x. This company specific fair ratio is more informative than a simple peer or industry comparison because it adjusts for how different Tempus AI is from the average Life Sciences stock. Comparing the Fair Ratio of 8.78x to the current 12.21x suggests the shares are trading ahead of fundamentals on a sales basis.
Result: OVERVALUED
PS ratios tell one story, but what if the real opportunity lies elsewhere? Discover 1450 companies where insiders are betting big on explosive growth.
Upgrade Your Decision Making: Choose your Tempus AI Narrative
Earlier we mentioned that there is an even better way to understand valuation, so let us introduce you to Narratives, which are simple stories you create about a company that tie your view of its future revenue, earnings and margins to a clear fair value estimate. A Narrative connects three pieces: the business story you believe in, the financial forecast that flows from that story, and the fair value that those numbers imply, so you can see exactly how your assumptions translate into a buy, hold or sell view. On Simply Wall St, millions of investors can build and compare Narratives for Tempus AI on the Community page. They can then track whether the current price looks attractive or stretched versus their Fair Value in real time as new earnings, guidance or news arrives. For instance, one investor might use a Narrative that mirrors the higher fair value of about $91, assuming strong AI powered margin expansion and fast revenue growth. Another could prefer a more cautious Narrative closer to $60 if they worry that competition, regulation and execution risks will cap Tempus AI’s profitability.
Do you think there's more to the story for Tempus AI? Head over to our Community to see what others are saying!
This article by Simply Wall St is general in nature. We provide commentary based on historical data and analyst forecasts only using an unbiased methodology and our articles are not intended to be financial advice. It does not constitute a recommendation to buy or sell any stock, and does not take account of your objectives, or your financial situation. We aim to bring you long-term focused analysis driven by fundamental data. Note that our analysis may not factor in the latest price-sensitive company announcements or qualitative material. Simply Wall St has no position in any stocks mentioned.
Have feedback on this article? Concerned about the content? Get in touch with us directly. Alternatively, email editorial-team@simplywallst.com