
- PREMIUM
- LIVE QUOTES
- INSTITUTION
 Index Options
 State Street
 CME Group
 Nasdaq
 Cboe
Cboe TradingView
 Wall Street Journal
Campbell Soup (CPB) Margin Gain Supports Bullish Valuation Gap Narrative in Q1 2026 Results
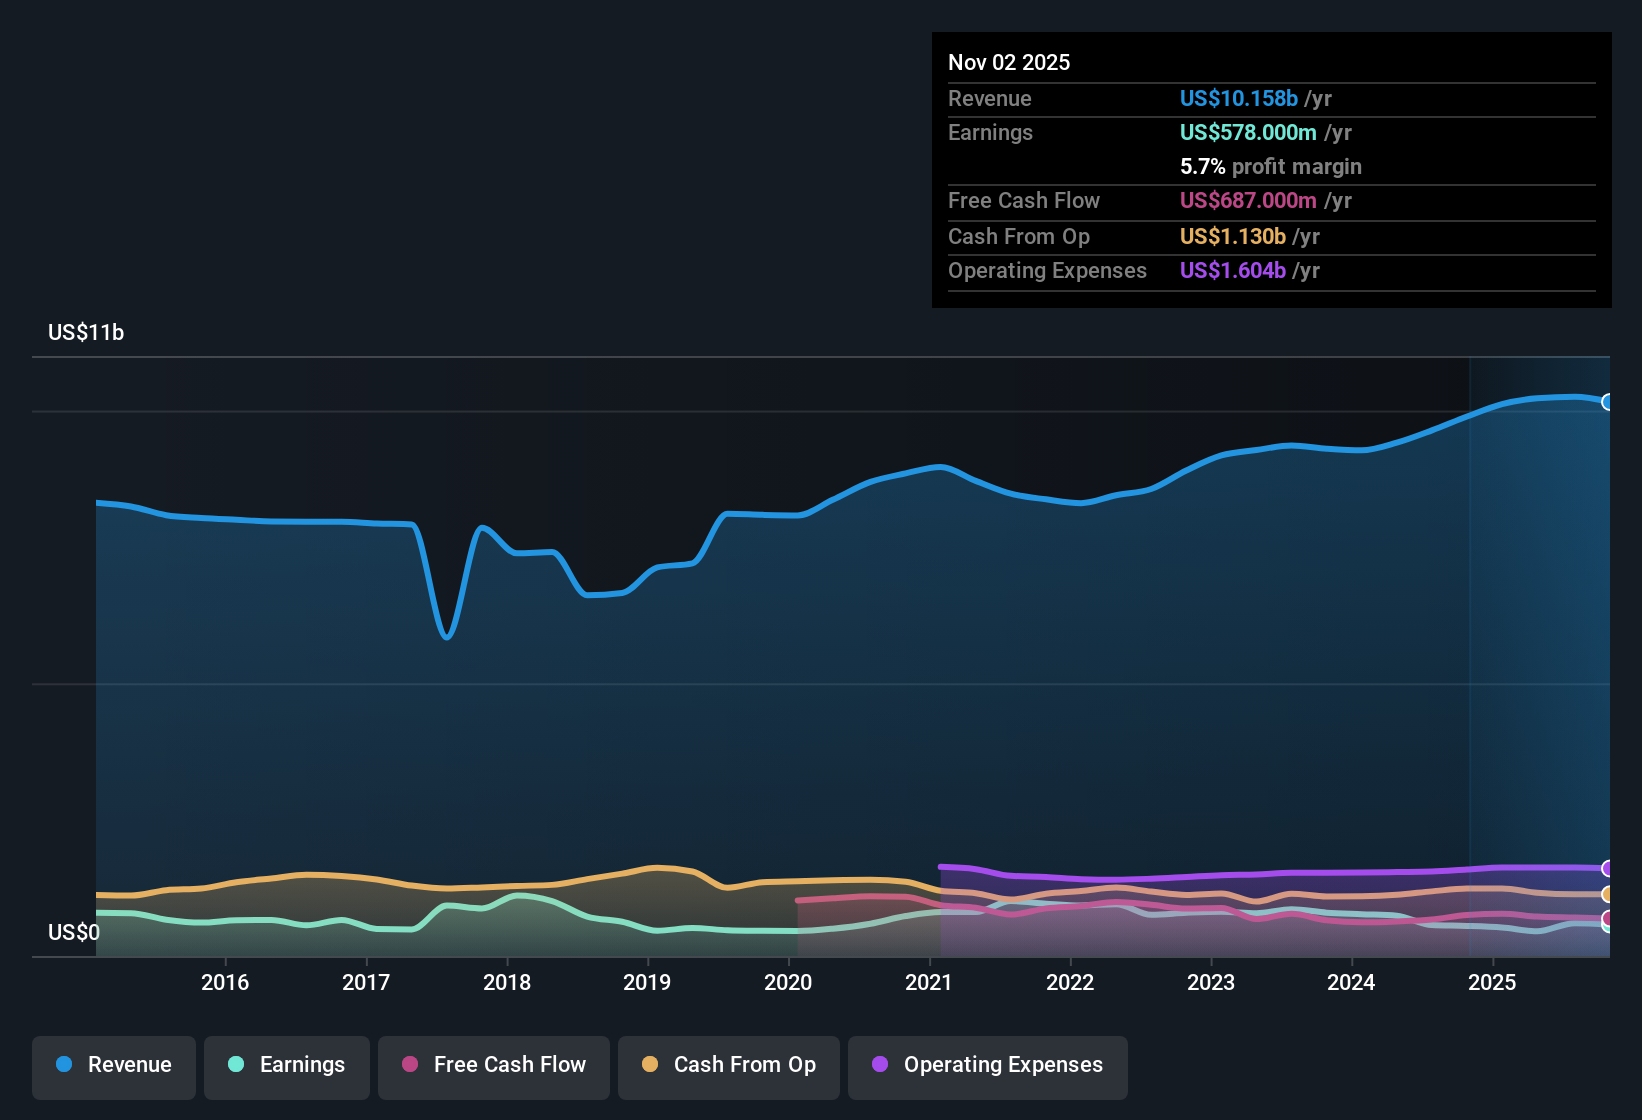
Campbell's (CPB) has kicked off Q1 2026 with revenue of $2.7 billion and net income of $194 million, translating to EPS of $0.65 as the company puts another steady quarter on the board. Over the past year, revenue has hovered around the $10.0 billion mark while trailing twelve month EPS has moved from $1.90 to $1.94, giving investors a clearer read on how recent quarters are feeding into overall profitability and margin resilience.
See our full analysis for Campbell's.With the headline numbers on the table, the next step is to assess how this earnings report compares with the key narratives around Campbell's, including its margin profile, growth expectations, and broader strategic direction.
See what the community is saying about Campbell's
Margins Nudge Up Despite Flat Sales
- Trailing net margin is 5.7% versus 5.5% a year ago, off the back of roughly $10.2 billion in annual revenue and $578 million in net income.
- Analysts consensus view leans on cost savings and premium products to support higher margins. However, the modest 0.5% annual revenue growth means
- the small margin lift so far has come more from efficiency than from stronger top line momentum
- and future gains will need those health focused innovations and brand pushes to show up more clearly in the revenue run rate.
Valuation Looks Cheap Against Fundamentals
- The current share price of $28.47 sits well below the $60.71 DCF fair value and trades on a 14.7x P E, under the US Food industry average of 20.6x.
- Supporters of the bullish case point to forecast earnings growth of about 12.9% per year and an earnings level expected to reach $868.6 million. Yet
- the five year history of earnings declining 10.1% per year shows the business has not consistently grown into past expectations
- so the apparent discount and 5.48% dividend yield still rely on Campbell's actually hitting that higher profit trajectory rather than just screening as cheap on paper.
Debt Coverage And One Off Loss Stand Out
- Over the last 12 months, a one off $349 million loss and the fact that debt is not well covered by operating cash flow both stand out next to a 5.7% net margin.
- Critics in the bearish camp highlight that these balance sheet and earnings quality flags can overshadow the recent 5.3% earnings growth, because
- the large one time hit muddies how durable the reported profit really is
- and weak cash flow coverage of debt limits financial flexibility if growth or margins stumble from here.
Next Steps
To see how these results tie into long-term growth, risks, and valuation, check out the full range of community narratives for Campbell's on Simply Wall St. Add the company to your watchlist or portfolio so you'll be alerted when the story evolves.
See the numbers from another angle and want that view heard? Turn it into a full narrative in just a few minutes: Do it your way.
A great starting point for your Campbell's research is our analysis highlighting 4 key rewards and 2 important warning signs that could impact your investment decision.
See What Else Is Out There
Campbell's faces questions over a large one off loss and limited cash flow coverage of debt, which cloud its earnings quality and financial resilience.
If those vulnerabilities give you pause, use our solid balance sheet and fundamentals stocks screener (1938 results) today to quickly zero in on financially stronger companies built to withstand shocks and uncertainty.
This article by Simply Wall St is general in nature. We provide commentary based on historical data and analyst forecasts only using an unbiased methodology and our articles are not intended to be financial advice. It does not constitute a recommendation to buy or sell any stock, and does not take account of your objectives, or your financial situation. We aim to bring you long-term focused analysis driven by fundamental data. Note that our analysis may not factor in the latest price-sensitive company announcements or qualitative material. Simply Wall St has no position in any stocks mentioned.
Have feedback on this article? Concerned about the content? Get in touch with us directly. Alternatively, email editorial-team@simplywallst.com