
- PREMIUM
- LIVE QUOTES
- INSTITUTION
 Index Options
 State Street
 CME Group
 Nasdaq
 Cboe
Cboe TradingView
 Wall Street Journal
In-Depth Analysis: Meta Platforms Versus Competitors In Interactive Media & Services Industry
In the ever-evolving and intensely competitive business landscape, conducting a thorough company analysis is of utmost importance for investors and industry followers. In this article, we will carry out an in-depth industry comparison, assessing Meta Platforms (NASDAQ:META) alongside its primary competitors in the Interactive Media & Services industry. By meticulously examining key financial metrics, market positioning, and growth prospects, we aim to offer valuable insights to investors and shed light on company's performance within the industry.
Meta Platforms Background
Meta is the largest social media company in the world, boasting close to 4 billion monthly active users worldwide. The firm's "Family of Apps," its core business, consists of Facebook, Instagram, Messenger, and WhatsApp. End users can leverage these applications for a variety of different purposes, from keeping in touch with friends to following celebrities and running digital businesses for free. Meta packages customer data, gleaned from its application ecosystem and sells ads to digital advertisers. While the firm has been investing heavily in its Reality Labs business, it remains a very small part of Meta's overall sales.
| Company | P/E | P/B | P/S | ROE | EBITDA (in billions) | Gross Profit (in billions) | Revenue Growth |
|---|---|---|---|---|---|---|---|
| Meta Platforms Inc | 29.80 | 8.75 | 9.19 | 1.39% | $26.85 | $42.04 | 26.25% |
| Alphabet Inc | 31.71 | 10.02 | 10.22 | 9.33% | $49.74 | $60.98 | 15.95% |
| Reddit Inc | 107.88 | 16.99 | 24.05 | 6.51% | $0.14 | $0.53 | 67.91% |
| Baidu Inc | 11.40 | 1.15 | 2.31 | -4.16% | $-12.51 | $12.86 | -7.1% |
| Pinterest Inc | 9.39 | 3.75 | 4.55 | 1.91% | $0.07 | $0.84 | 16.79% |
| Bilibili Inc | 101.36 | 5.07 | 2.66 | 3.24% | $0.5 | $2.82 | 5.2% |
| CarGurus Inc | 24.22 | 9.11 | 4.02 | 11.03% | $0.06 | $0.21 | 3.17% |
| ZoomInfo Technologies Inc | 32.06 | 2.02 | 2.66 | 2.51% | $0.09 | $0.27 | 4.74% |
| Weibo Corp | 5.95 | 0.66 | 1.60 | 5.93% | $0.12 | $0.34 | -4.77% |
| Yelp Inc | 13.25 | 2.49 | 1.35 | 5.32% | $0.07 | $0.34 | 4.36% |
| Tripadvisor Inc | 25.53 | 2.53 | 1.11 | 7.95% | $0.1 | $0.51 | 3.95% |
| Ziff Davis Inc | 13.70 | 0.77 | 1.01 | -0.2% | $0.07 | $0.31 | 2.87% |
| Taboola.com Ltd | 49.38 | 1.25 | 0.68 | 0.57% | $0.03 | $0.14 | 14.72% |
| Hello Group Inc | 10.53 | 0.74 | 0.84 | -1.28% | $0.53 | $1.01 | -2.64% |
| Yalla Group Ltd | 8.72 | 1.43 | 3.71 | 5.38% | $0.03 | $0.06 | 0.8% |
| Average | 31.79 | 4.14 | 4.34 | 3.86% | $2.79 | $5.8 | 9.0% |
When closely examining Meta Platforms, the following trends emerge:
With a Price to Earnings ratio of 29.8, which is 0.94x less than the industry average, the stock shows potential for growth at a reasonable price, making it an interesting consideration for market participants.
The elevated Price to Book ratio of 8.75 relative to the industry average by 2.11x suggests company might be overvalued based on its book value.
With a relatively high Price to Sales ratio of 9.19, which is 2.12x the industry average, the stock might be considered overvalued based on sales performance.
The Return on Equity (ROE) of 1.39% is 2.47% below the industry average, suggesting potential inefficiency in utilizing equity to generate profits.
The Earnings Before Interest, Taxes, Depreciation, and Amortization (EBITDA) of $26.85 Billion is 9.62x above the industry average, highlighting stronger profitability and robust cash flow generation.
With higher gross profit of $42.04 Billion, which indicates 7.25x above the industry average, the company demonstrates stronger profitability and higher earnings from its core operations.
The company's revenue growth of 26.25% is notably higher compared to the industry average of 9.0%, showcasing exceptional sales performance and strong demand for its products or services.
Debt To Equity Ratio
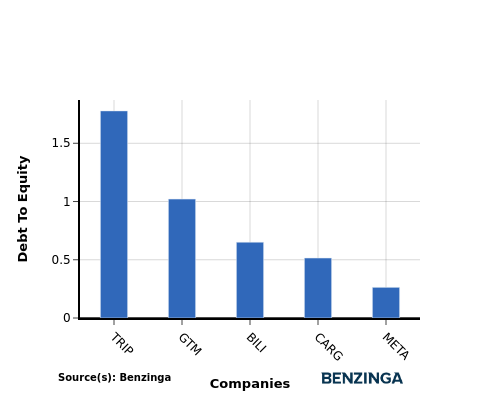
The debt-to-equity (D/E) ratio is a measure that indicates the level of debt a company has taken on relative to the value of its assets net of liabilities.
Considering the debt-to-equity ratio in industry comparisons allows for a concise evaluation of a company's financial health and risk profile, aiding in informed decision-making.
By analyzing Meta Platforms in relation to its top 4 peers based on the Debt-to-Equity ratio, the following insights can be derived:
Among its top 4 peers, Meta Platforms has a stronger financial position with a lower debt-to-equity ratio of 0.26.
This indicates that the company relies less on debt financing and maintains a more favorable balance between debt and equity, which can be viewed positively by investors.
Key Takeaways
For Meta Platforms, the PE ratio is low compared to peers, indicating potential undervaluation. The high PB and PS ratios suggest the market values the company's assets and sales highly. In terms of ROE, Meta Platforms shows lower profitability compared to peers. However, its high EBITDA, gross profit, and revenue growth indicate strong operational performance and growth potential within the Interactive Media & Services industry.
This article was generated by Benzinga's automated content engine and reviewed by an editor.