
- PREMIUM
- LIVE QUOTES
- INSTITUTION
 Index Options
 State Street
 CME Group
 Nasdaq
 Cboe
Cboe TradingView
 Wall Street Journal
3 European Penny Stocks With Market Caps Under €30M
As the European markets show mixed performance, with the pan-European STOXX Europe 600 Index edging higher on interest rate cut hopes, investors are increasingly exploring diverse opportunities within smaller market segments. Penny stocks, though often viewed as a relic of past trading days, continue to offer compelling prospects for those seeking growth at lower price points. These stocks typically represent smaller or newer companies and can provide significant value when backed by strong financials and sound fundamentals.
Top 10 Penny Stocks In Europe
| Name | Share Price | Market Cap | Rewards & Risks |
| Orthex Oyj (HLSE:ORTHEX) | €4.68 | €83.11M | ✅ 4 ⚠️ 1 View Analysis > |
| Lucisano Media Group (BIT:LMG) | €0.985 | €14.63M | ✅ 4 ⚠️ 5 View Analysis > |
| DigiTouch (BIT:DGT) | €1.98 | €27.36M | ✅ 3 ⚠️ 1 View Analysis > |
| Angler Gaming (NGM:ANGL) | SEK3.60 | SEK269.95M | ✅ 4 ⚠️ 2 View Analysis > |
| Angler Gaming (DB:0QM) | €0.37 | €231.7M | ✅ 3 ⚠️ 3 View Analysis > |
| Libertas 7 (BME:LIB) | €3.10 | €65.75M | ✅ 3 ⚠️ 3 View Analysis > |
| Hultstrom Group (OM:HULT B) | SEK3.26 | SEK198.33M | ✅ 2 ⚠️ 2 View Analysis > |
| ForFarmers (ENXTAM:FFARM) | €4.37 | €386.24M | ✅ 4 ⚠️ 1 View Analysis > |
| Deceuninck (ENXTBR:DECB) | €2.28 | €315.14M | ✅ 3 ⚠️ 1 View Analysis > |
| Netgem (ENXTPA:ALNTG) | €0.838 | €28.06M | ✅ 2 ⚠️ 2 View Analysis > |
Click here to see the full list of 276 stocks from our European Penny Stocks screener.
We'll examine a selection from our screener results.
Afarak Group (HLSE:AFAGR)
Simply Wall St Financial Health Rating: ★★★★☆☆
Overview: Afarak Group SE extracts, processes, markets, and trades specialized metals globally with a market cap of €67.96 million.
Operations: The company's revenue is primarily derived from its Speciality Alloys segment, which generated €120.43 million, complemented by the Ferro Alloys segment with €13.05 million.
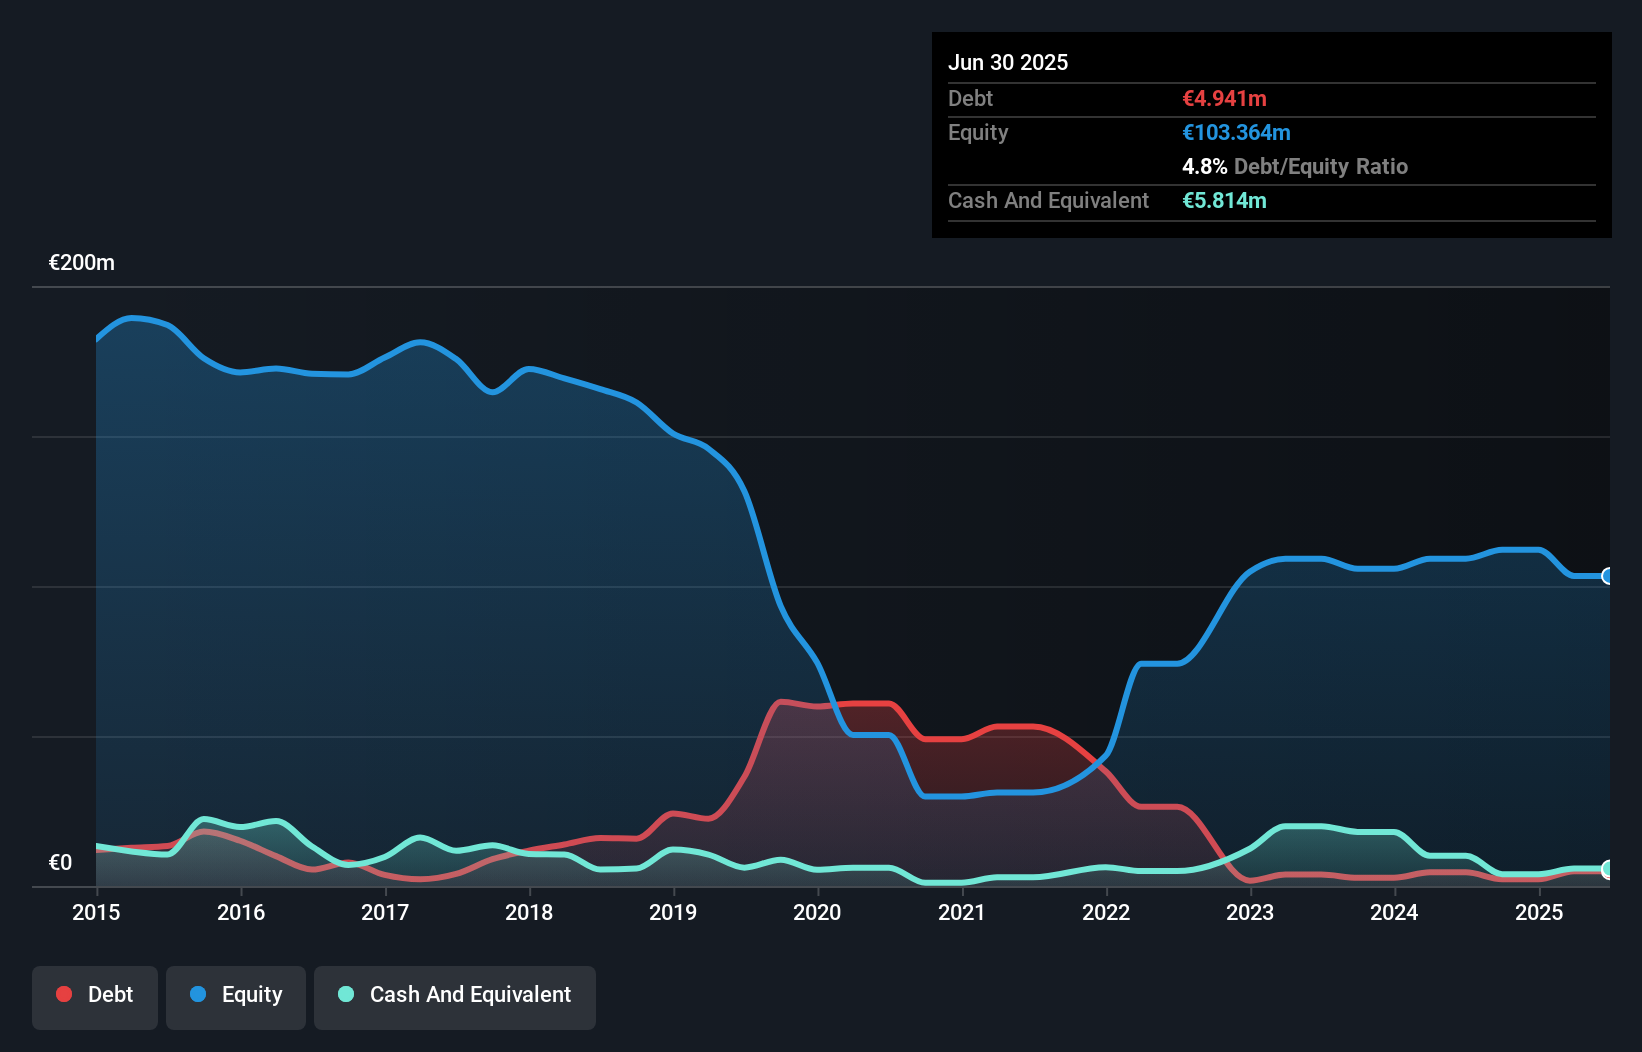
Market Cap: €67.96M
Afarak Group SE, with a market cap of €67.96 million, derives most of its revenue from the Speciality Alloys segment (€120.43 million). Despite being unprofitable and having increased losses over five years, Afarak's debt situation has improved significantly, reducing its debt to equity ratio from 120.8% to 4.8%. The company holds more cash than total debt and covers long-term liabilities with short-term assets (€55.9M vs €23.3M). Recent production results show an increase in Speciality Alloys output but a decline in South African mine production compared to last year, reflecting operational challenges amidst financial restructuring efforts.
- Dive into the specifics of Afarak Group here with our thorough balance sheet health report.
- Learn about Afarak Group's historical performance here.
Binero Group (OM:BINERO)
Simply Wall St Financial Health Rating: ★★★★☆☆
Overview: Binero Group AB (publ) provides cloud and platform services across Sweden, Norway, Denmark, and Finland with a market capitalization of SEK301.24 million.
Operations: The company's revenue segment is focused on Internet Software & Services, generating SEK440.08 million.
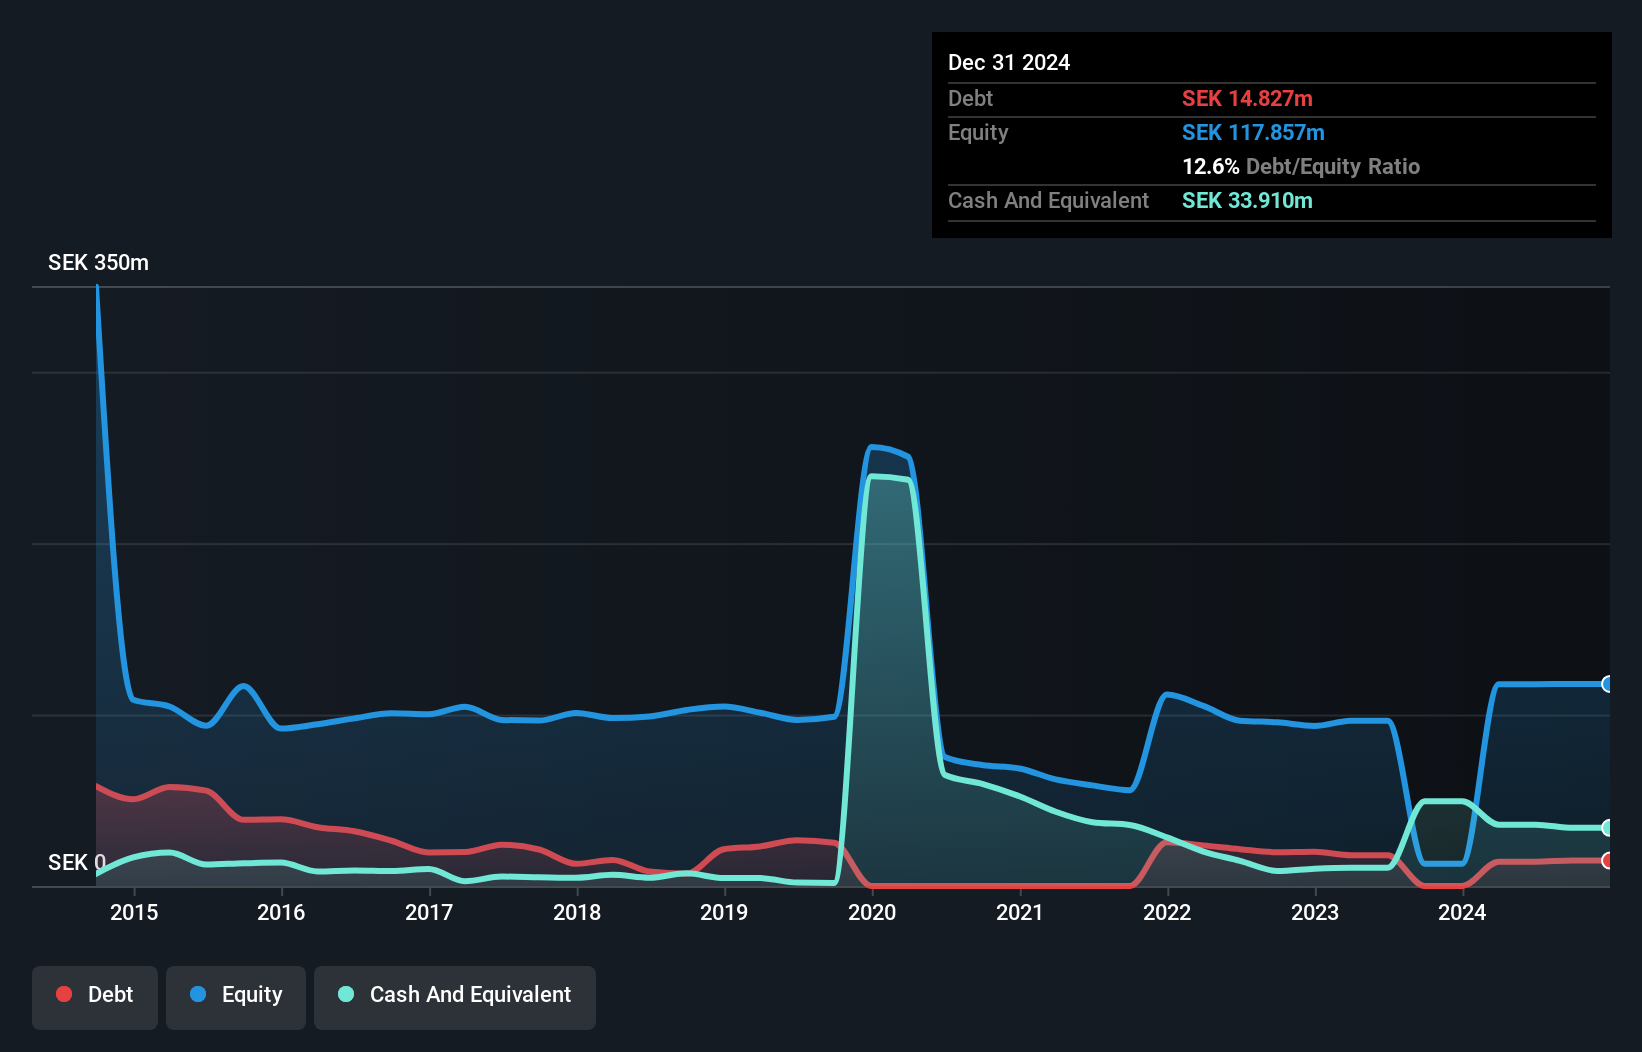
Market Cap: SEK301.24M
Binero Group AB, with a market cap of SEK301.24 million, operates in the Internet Software & Services sector, generating SEK440.08 million in revenue. Despite being unprofitable, it has reduced losses annually by 29.8% over five years and maintains a satisfactory net debt to equity ratio of 19.4%. However, short-term liabilities exceed assets (SEK181.7M vs SEK116.9M), indicating liquidity challenges despite covering long-term obligations with short-term assets (SEK90.5M). The management team is relatively new with an average tenure of 1.5 years but holds sufficient cash runway for over three years based on current free cash flow trends.
- Click here and access our complete financial health analysis report to understand the dynamics of Binero Group.
- Understand Binero Group's earnings outlook by examining our growth report.
Planoptik (XTRA:P4O)
Simply Wall St Financial Health Rating: ★★★★★★
Overview: Planoptik AG, with a market cap of €19.79 million, manufactures and sells structured wafers in Germany.
Operations: The company's revenue primarily comes from its Glass & Clay Products segment, which generated €11.94 million.
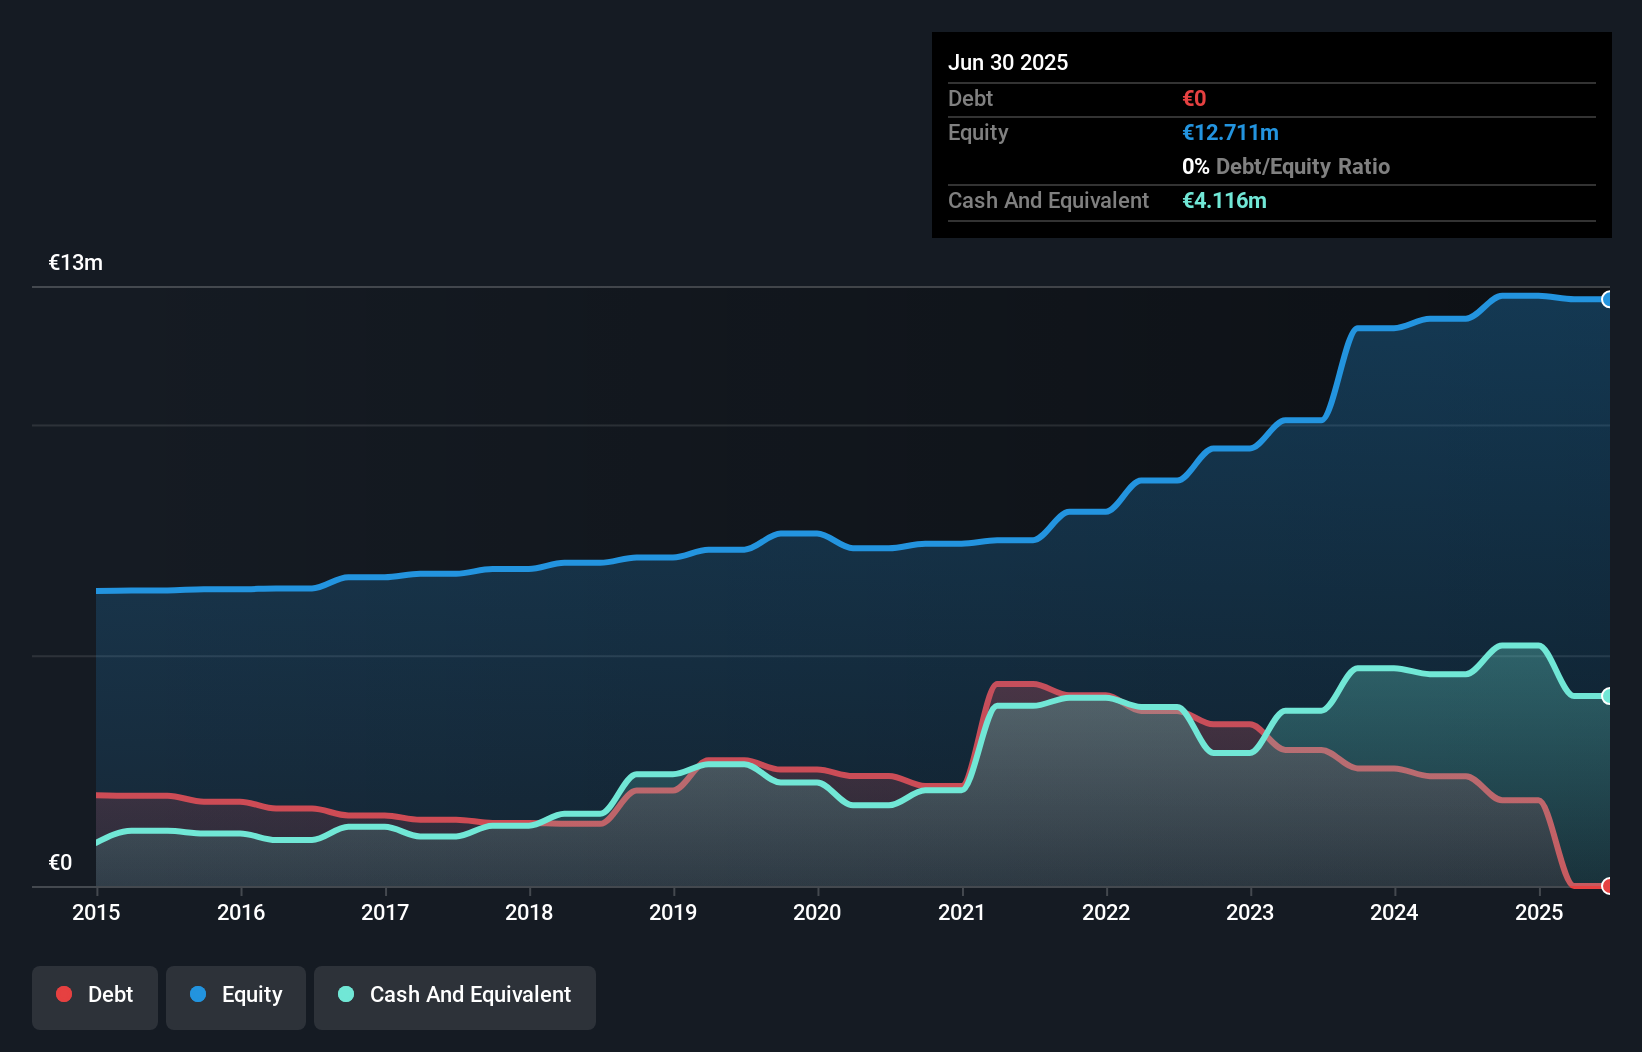
Market Cap: €19.79M
Planoptik AG, with a market cap of €19.79 million, operates debt-free and maintains a solid balance sheet as short-term assets (€10.6M) exceed both short-term (€2.9M) and long-term liabilities (€3.2M). Despite significant earnings growth over the past five years, recent performance has been challenging with negative earnings growth (-63.4%) over the past year and profit margins declining from 10% to 3.9%. The company reported stable sales of €5.99 million for H1 2025 but incurred a net loss of €0.04 million compared to a net income last year, reflecting current profitability pressures in its operations.
- Navigate through the intricacies of Planoptik with our comprehensive balance sheet health report here.
- Assess Planoptik's previous results with our detailed historical performance reports.
Taking Advantage
- Reveal the 276 hidden gems among our European Penny Stocks screener with a single click here.
- Looking For Alternative Opportunities? This technology could replace computers: discover the 28 stocks are working to make quantum computing a reality.
This article by Simply Wall St is general in nature. We provide commentary based on historical data and analyst forecasts only using an unbiased methodology and our articles are not intended to be financial advice. It does not constitute a recommendation to buy or sell any stock, and does not take account of your objectives, or your financial situation. We aim to bring you long-term focused analysis driven by fundamental data. Note that our analysis may not factor in the latest price-sensitive company announcements or qualitative material. Simply Wall St has no position in any stocks mentioned.
Have feedback on this article? Concerned about the content? Get in touch with us directly. Alternatively, email editorial-team@simplywallst.com