
- PREMIUM
- LIVE QUOTES
- INSTITUTION
 Index Options
 State Street
 CME Group
 Nasdaq
 Cboe
Cboe TradingView
 Wall Street Journal
Evolution AB (publ)'s (STO:EVO) last week's 4.7% decline must have disappointed retail investors who have a significant stake
Key Insights
- Evolution's significant retail investors ownership suggests that the key decisions are influenced by shareholders from the larger public
- 50% of the business is held by the top 6 shareholders
- 35% of Evolution is held by insiders
To get a sense of who is truly in control of Evolution AB (publ) (STO:EVO), it is important to understand the ownership structure of the business. And the group that holds the biggest piece of the pie are retail investors with 36% ownership. Put another way, the group faces the maximum upside potential (or downside risk).
While insiders, who own 35% shares weren’t spared from last week’s kr6.2b market cap drop, retail investors as a group suffered the maximum losses
In the chart below, we zoom in on the different ownership groups of Evolution.
Check out our latest analysis for Evolution

What Does The Institutional Ownership Tell Us About Evolution?
Many institutions measure their performance against an index that approximates the local market. So they usually pay more attention to companies that are included in major indices.
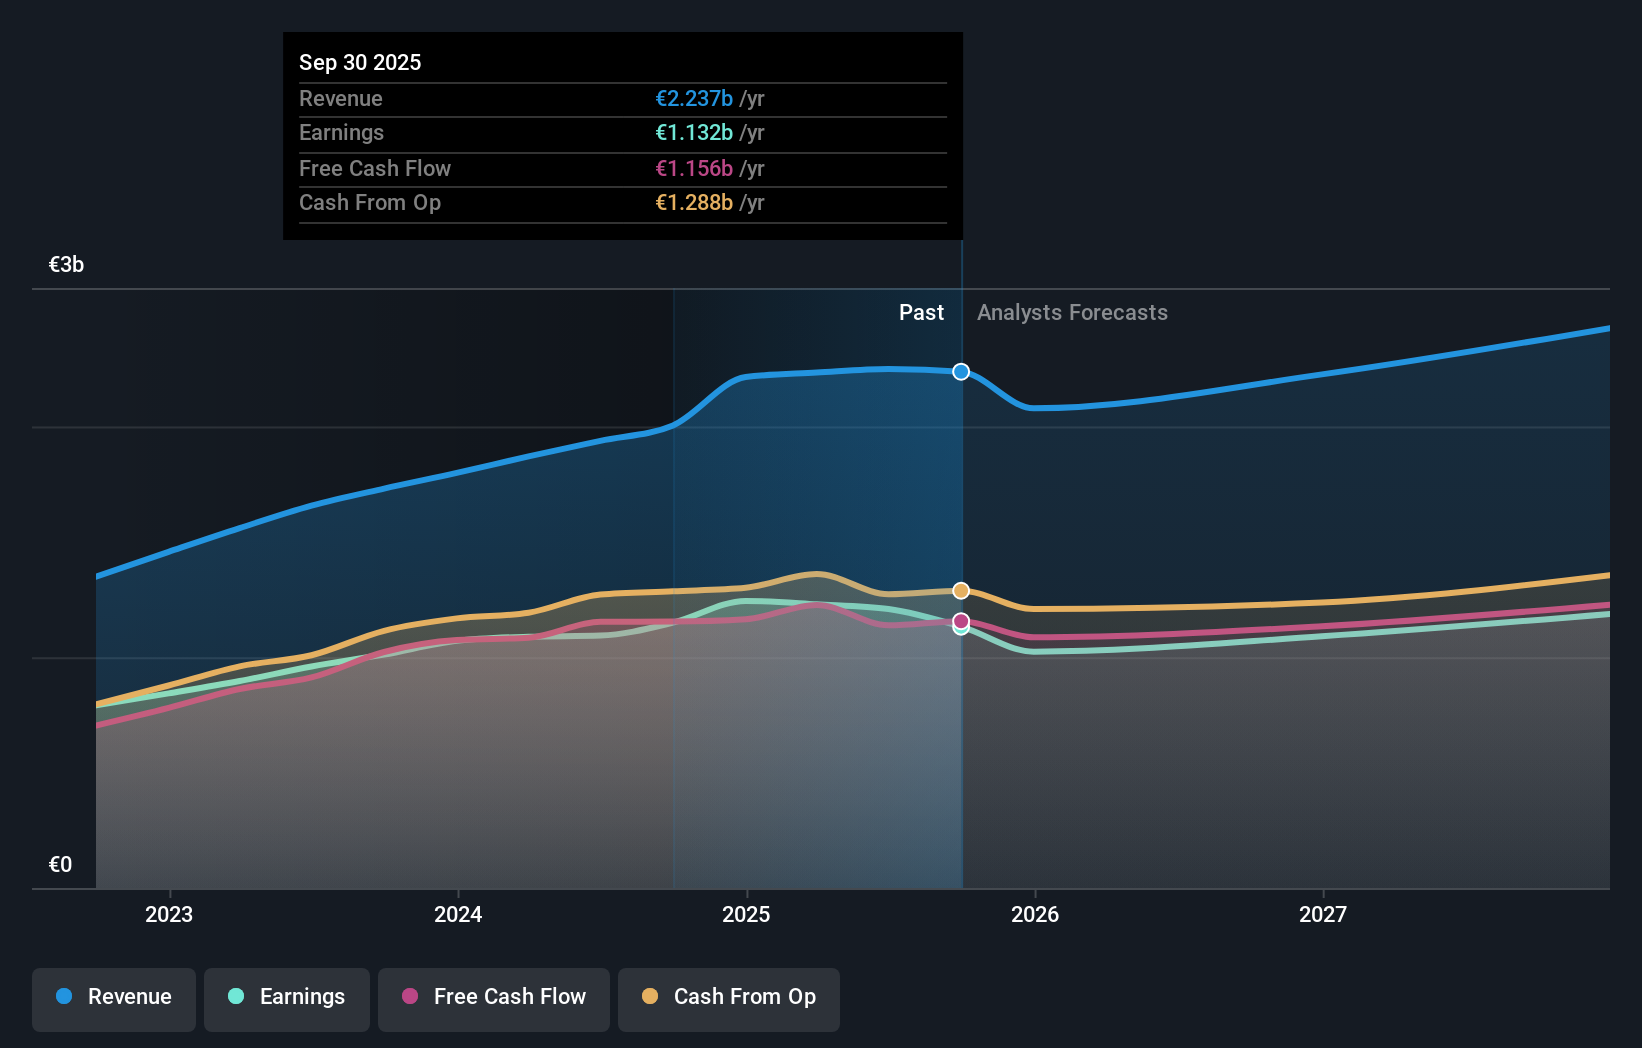
We can see that Evolution does have institutional investors; and they hold a good portion of the company's stock. This suggests some credibility amongst professional investors. But we can't rely on that fact alone since institutions make bad investments sometimes, just like everyone does. When multiple institutions own a stock, there's always a risk that they are in a 'crowded trade'. When such a trade goes wrong, multiple parties may compete to sell stock fast. This risk is higher in a company without a history of growth. You can see Evolution's historic earnings and revenue below, but keep in mind there's always more to the story.
Hedge funds don't have many shares in Evolution. Looking at our data, we can see that the largest shareholder is Kenneth Dart with 21% of shares outstanding. Jens von Bahr is the second largest shareholder owning 11% of common stock, and Capital Research and Management Company holds about 11% of the company stock. Jens von Bahr, who is the second-largest shareholder, also happens to hold the title of President.
We did some more digging and found that 6 of the top shareholders account for roughly 50% of the register, implying that along with larger shareholders, there are a few smaller shareholders, thereby balancing out each others interests somewhat.
While studying institutional ownership for a company can add value to your research, it is also a good practice to research analyst recommendations to get a deeper understand of a stock's expected performance. Quite a few analysts cover the stock, so you could look into forecast growth quite easily.
Insider Ownership Of Evolution
The definition of company insiders can be subjective and does vary between jurisdictions. Our data reflects individual insiders, capturing board members at the very least. Company management run the business, but the CEO will answer to the board, even if he or she is a member of it.
I generally consider insider ownership to be a good thing. However, on some occasions it makes it more difficult for other shareholders to hold the board accountable for decisions.
Our information suggests that insiders maintain a significant holding in Evolution AB (publ). Insiders own kr43b worth of shares in the kr124b company. That's quite meaningful. Most would be pleased to see the board is investing alongside them. You may wish to access this free chart showing recent trading by insiders.
General Public Ownership
With a 36% ownership, the general public, mostly comprising of individual investors, have some degree of sway over Evolution. While this group can't necessarily call the shots, it can certainly have a real influence on how the company is run.
Next Steps:
It's always worth thinking about the different groups who own shares in a company. But to understand Evolution better, we need to consider many other factors.
I like to dive deeper into how a company has performed in the past. You can find historic revenue and earnings in this detailed graph.
If you are like me, you may want to think about whether this company will grow or shrink. Luckily, you can check this free report showing analyst forecasts for its future.
NB: Figures in this article are calculated using data from the last twelve months, which refer to the 12-month period ending on the last date of the month the financial statement is dated. This may not be consistent with full year annual report figures.
Have feedback on this article? Concerned about the content? Get in touch with us directly. Alternatively, email editorial-team (at) simplywallst.com.
This article by Simply Wall St is general in nature. We provide commentary based on historical data and analyst forecasts only using an unbiased methodology and our articles are not intended to be financial advice. It does not constitute a recommendation to buy or sell any stock, and does not take account of your objectives, or your financial situation. We aim to bring you long-term focused analysis driven by fundamental data. Note that our analysis may not factor in the latest price-sensitive company announcements or qualitative material. Simply Wall St has no position in any stocks mentioned.