
- PREMIUM
- LIVE QUOTES
- INSTITUTION
 Index Options
 State Street
 CME Group
 Nasdaq
 Cboe
Cboe TradingView
 Wall Street Journal
Dorchester Minerals (DMLP): Reassessing Valuation After a Steep Year-to-Date Price Pullback
Dorchester Minerals (DMLP) has quietly lagged this year, with the unit price sliding about 34% year to date even as long term total returns remain positive. This mix raises fresh valuation questions.
See our latest analysis for Dorchester Minerals.
That steep year to date share price slide to around $22.99 looks more like a reset in sentiment than a broken story, especially given the partnership’s solid 5 year total shareholder return. This suggests long term momentum is still intact even as near term enthusiasm has cooled.
If this pullback has you rethinking your energy exposure, it could also be a good moment to broaden your search and explore fast growing stocks with high insider ownership.
With units now trading at a hefty intrinsic discount, yet still backed by decades old royalty assets, investors are left asking whether Dorchester Minerals is quietly undervalued or if the market is wisely pricing in slower future growth.
Price to Earnings of 20.8x: Is it justified?
Dorchester Minerals trades on a price to earnings ratio of 20.8x at a last close of $22.99, which looks modestly valued against peers but rich versus its own industry.
The price to earnings multiple compares what investors are willing to pay today for each dollar of the partnership’s current earnings. For a royalty focused energy business with long lived assets, this ratio often reflects how durable the market believes those cash flows will be across cycles.
Relative to a peer average of 27.2x, DMLP screens as good value on this measure, hinting that the market may be assigning a discount to its earnings power despite a 5 year earnings growth rate of 13.8% a year and high quality profits. However, the partnership is also trading on a richer multiple than the broader US Oil and Gas industry average of 13.8x, which signals investors are still willing to pay a premium for its cleaner balance sheet compared with operators and its royalty based model even after a year of sharply lower earnings.
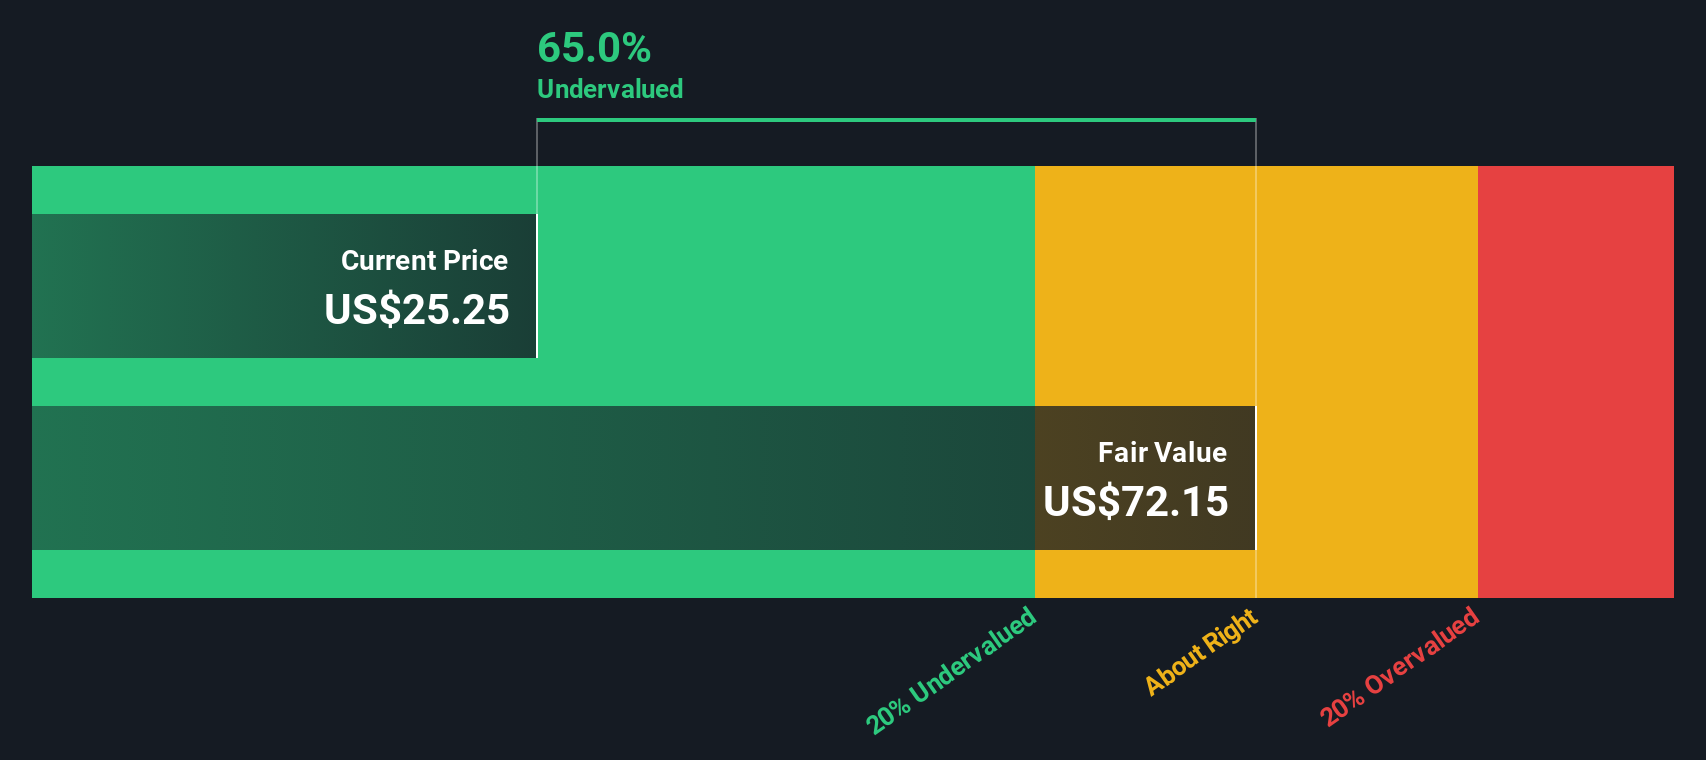
Against that backdrop, our DCF work suggests the units are trading about 65.7% below an intrinsic value estimate of roughly $67.09, underlining how current market pricing implies a far more muted long term cash flow outlook than the SWS DCF model.
See what the numbers say about this price — find out in our valuation breakdown.
Result: Price to Earnings of 20.8x (UNDERVALUED)
However, softer commodity prices or prolonged production declines from its underlying acreage could quickly compress royalty income and challenge that undervaluation thesis.
Find out about the key risks to this Dorchester Minerals narrative.
Another View: Cash Flows Paint a Different Picture
While a 20.8x earnings multiple makes Dorchester Minerals look only modestly cheap versus peers, the SWS DCF model is far more optimistic. It points to a fair value near $67 and a hefty 65.7% discount. Is the market missing something in those long run cash flows, or is the model too generous?
Look into how the SWS DCF model arrives at its fair value.
Simply Wall St performs a discounted cash flow (DCF) on every stock in the world every day (check out Dorchester Minerals for example). We show the entire calculation in full. You can track the result in your watchlist or portfolio and be alerted when this changes, or use our stock screener to discover 908 undervalued stocks based on their cash flows. If you save a screener we even alert you when new companies match - so you never miss a potential opportunity.
Build Your Own Dorchester Minerals Narrative
If you see the numbers differently or prefer to dig into the details yourself, you can shape a complete story in just a few minutes: Do it your way.
A great starting point for your Dorchester Minerals research is our analysis highlighting 1 key reward and 2 important warning signs that could impact your investment decision.
Ready for your next investment move?
Before you move on, lock in an edge by scanning focused stock lists on Simply Wall St’s Screener so you are not leaving better opportunities on the table.
- Capture potential income by targeting reliable payouts across sectors through these 15 dividend stocks with yields > 3% to help strengthen your portfolio’s cash flow.
- Position yourself at the forefront of innovation by tracking companies harnessing machine learning and automation within these 26 AI penny stocks to reshape entire industries.
- Sharpen your value strategy by zeroing in on mispriced opportunities using these 908 undervalued stocks based on cash flows that may be trading below their long term cash flow potential.
This article by Simply Wall St is general in nature. We provide commentary based on historical data and analyst forecasts only using an unbiased methodology and our articles are not intended to be financial advice. It does not constitute a recommendation to buy or sell any stock, and does not take account of your objectives, or your financial situation. We aim to bring you long-term focused analysis driven by fundamental data. Note that our analysis may not factor in the latest price-sensitive company announcements or qualitative material. Simply Wall St has no position in any stocks mentioned.
Have feedback on this article? Concerned about the content? Get in touch with us directly. Alternatively, email editorial-team@simplywallst.com