
- PREMIUM
- LIVE QUOTES
- INSTITUTION
 Index Options
 State Street
 CME Group
 Nasdaq
 Cboe
Cboe TradingView
 Wall Street Journal
Assessing Lumentum Holdings’ Soaring 2025 Valuation After Massive Multi‑Year Share Price Rally
- If you are wondering whether Lumentum Holdings is still a smart buy after its huge run, you are not alone. This article will walk through what the current share price might be telling us about its real value.
- The stock has surged recently, up 1.9% over the last week, 38.0% over the last month, and 287.2% year to date, building on a 257.0% gain over the past year and more than quintupling, 509.1%, over three years.
- Much of this momentum has been driven by upbeat sentiment around optical and photonics demand in data centers and telecom, alongside growing interest in components that could benefit from AI infrastructure build outs. At the same time, investors have been reacting to industry consolidation moves and strategic updates from peers, which helps frame how the market is repricing Lumentum’s long term prospects.
- Despite all that excitement, Lumentum currently scores just 0/6 on our valuation checks. In the next sections we will unpack what traditional valuation methods say about the stock, and then finish by looking at another way to think about its value in context.
Lumentum Holdings scores just 0/6 on our valuation checks. See what other red flags we found in the full valuation breakdown.
Approach 1: Lumentum Holdings Discounted Cash Flow (DCF) Analysis
A Discounted Cash Flow model estimates what a business is worth today by projecting the cash it could generate in the future and then discounting those cash flows back to today in dollar terms.
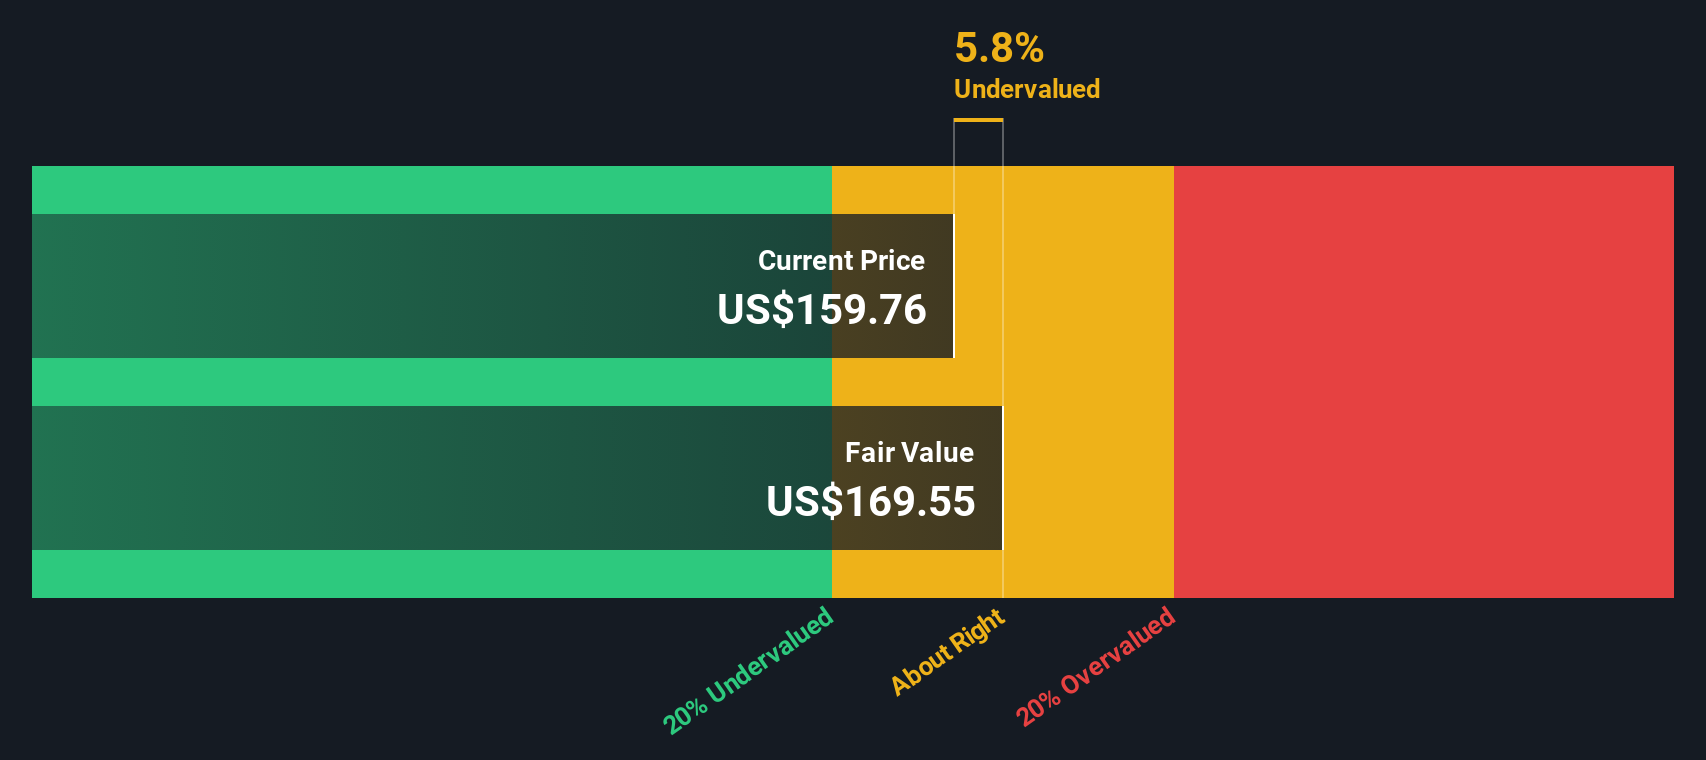
For Lumentum Holdings, the 2 Stage Free Cash Flow to Equity model starts from a weak base, with last twelve month free cash flow at roughly $64.1 million in the red. Analysts, however, expect a sharp turnaround, with free cash flow projected to climb to about $647.7 million by 2028. Simply Wall St then extends these forecasts out a further decade using gradually slowing growth assumptions.
After discounting all these future cash flows back to today, the model arrives at an estimated intrinsic value of about $234.35 per share. When this is compared with the current market price, the DCF implies the stock is roughly 41.4% above its calculated fair value, meaning the recent share price surge is running well ahead of the modelled fundamentals.
Result: OVERVALUED
Our Discounted Cash Flow (DCF) analysis suggests Lumentum Holdings may be overvalued by 41.4%. Discover 908 undervalued stocks or create your own screener to find better value opportunities.
Approach 2: Lumentum Holdings Price vs Sales
For Lumentum, the preferred yardstick is the Price to Sales ratio. This can be useful for fast growing or less consistently profitable companies because it focuses on how highly the market values each dollar of revenue, rather than current earnings that might be volatile.
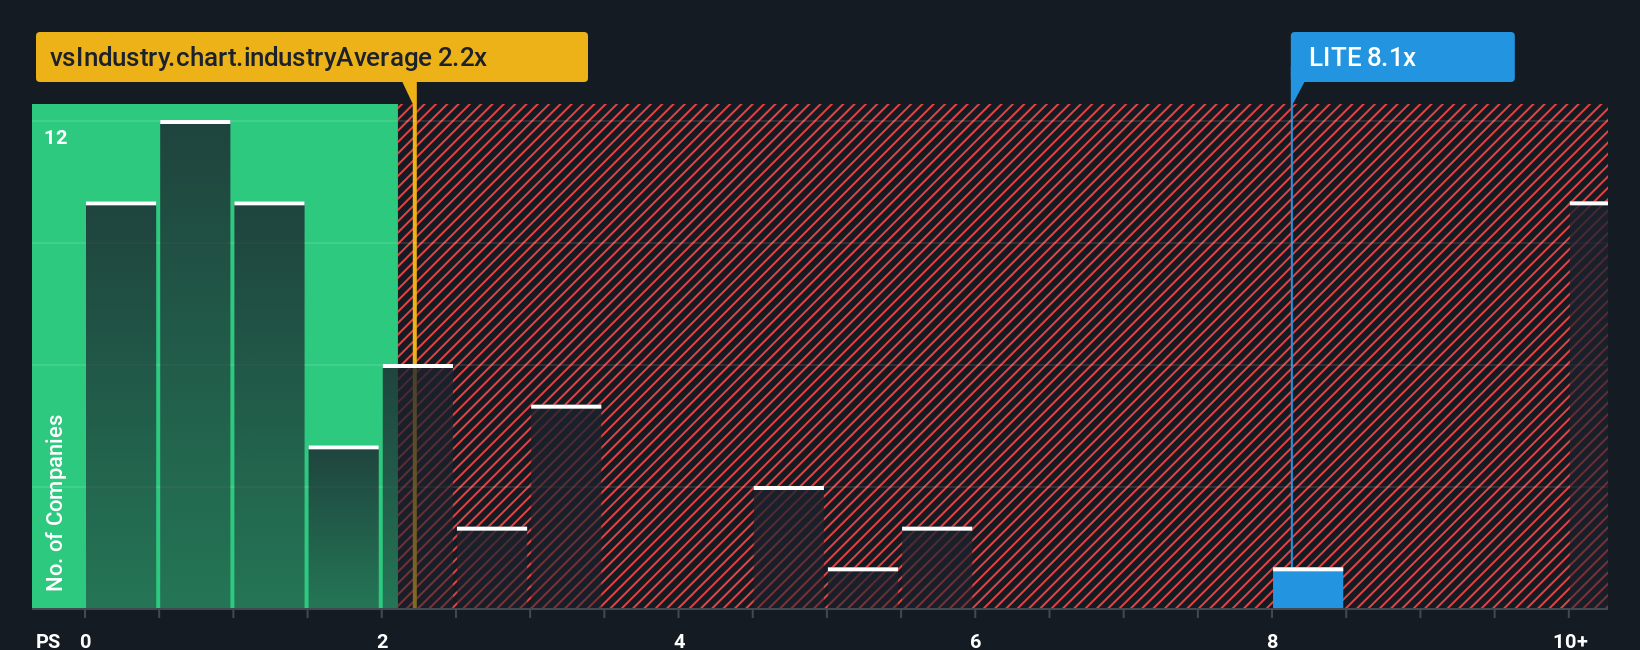
In general, higher growth expectations and lower perceived risk justify a richer multiple. Slower growth or greater uncertainty usually mean a lower, more conservative valuation is warranted. Lumentum currently trades on a Price to Sales ratio of about 12.8x, which is far above the broader Communications industry average of roughly 2.0x and also well above its peer group average of around 7.3x.
Simply Wall St’s Fair Ratio framework estimates what a reasonable Price to Sales multiple should be by blending in factors like Lumentum’s growth outlook, profitability, risk profile, industry and market size. This makes it more tailored than simple peer or industry comparisons, which can ignore important differences between businesses. On this basis, Lumentum’s Fair Ratio is calculated at about 5.2x, significantly below its current 12.8x. This suggests the shares are richly priced even after accounting for their stronger prospects.
Result: OVERVALUED
PS ratios tell one story, but what if the real opportunity lies elsewhere? Discover 1452 companies where insiders are betting big on explosive growth.
Upgrade Your Decision Making: Choose your Lumentum Holdings Narrative
Earlier we mentioned that there is an even better way to understand valuation, so let us introduce you to Narratives, a simple way to connect the story you believe about a company with concrete forecasts for its revenue, earnings, margins and, ultimately, its fair value.
A Narrative on Simply Wall St is your view of how the business will evolve, translated into numbers and timeframes, so that the story, the financial forecast and the resulting fair value are all aligned and easy to compare to the current share price.
These Narratives, available on the Community page used by millions of investors, make it straightforward to see when your estimated fair value suggests Lumentum might be a buy, a hold, or a sell. They automatically update as new earnings, news and guidance change the outlook.
For example, one Lumentum Narrative on the platform might assume very strong AI driven growth, high margins and a fair value near the top end of recent analyst targets. A more cautious Narrative could lean closer to the lowest targets, building in slower growth or execution risks. The difference between those fair values gives you a clear, numbers based view of how bullish or bearish each perspective really is.
Do you think there's more to the story for Lumentum Holdings? Head over to our Community to see what others are saying!
This article by Simply Wall St is general in nature. We provide commentary based on historical data and analyst forecasts only using an unbiased methodology and our articles are not intended to be financial advice. It does not constitute a recommendation to buy or sell any stock, and does not take account of your objectives, or your financial situation. We aim to bring you long-term focused analysis driven by fundamental data. Note that our analysis may not factor in the latest price-sensitive company announcements or qualitative material. Simply Wall St has no position in any stocks mentioned.
Have feedback on this article? Concerned about the content? Get in touch with us directly. Alternatively, email editorial-team@simplywallst.com