
- PREMIUM
- LIVE QUOTES
- INSTITUTIONS
 Index Options
 State Street
 CME Group
 Nasdaq
 Cboe
Cboe TradingView
 Wall Street Journal
Is It Too Late to Consider Palantir After Its 2,456% Three Year Surge?
- If you are wondering whether Palantir Technologies is still worth buying after its huge run, you are not alone. That is exactly what this valuation deep dive is here to unpack.
- The stock has surged 141.7% year to date and 138.1% over the last year, with a massive 2,456.4% gain over three years, even after a more modest 7.9% move in the last week and 2.2% over the past month.
- Much of this momentum has been driven by Palantir's positioning as a key software and data analytics player for governments and enterprises, especially around AI enabled decision making and defense related contracts. Investors have also reacted to a steady drumbeat of partnership announcements and expanding use cases, which has reinforced the narrative that Palantir could be a long term infrastructure player for mission critical data.
- Despite that excitement, Palantir currently scores just 0/6 on our valuation checks, which suggests the market may be pricing in a lot of future success already. In the sections ahead, we will walk through different valuation approaches to see what is baked into today's price and then finish with a more intuitive way to think about Palantir's long term value story.
Palantir Technologies scores just 0/6 on our valuation checks. See what other red flags we found in the full valuation breakdown.
Approach 1: Palantir Technologies Discounted Cash Flow (DCF) Analysis
A Discounted Cash Flow model estimates what a company is worth by projecting its future cash flows and then discounting them back to today, to reflect the time value and risk of that money.
Palantir Technologies currently generates about $1.79 billion in Free Cash Flow, and analysts, along with Simply Wall St extrapolations, project this could rise to roughly $13.82 billion by 2035. These forecasts combine a few years of analyst estimates with a gradual slowdown in expected growth over the following years, which is typical as companies mature.
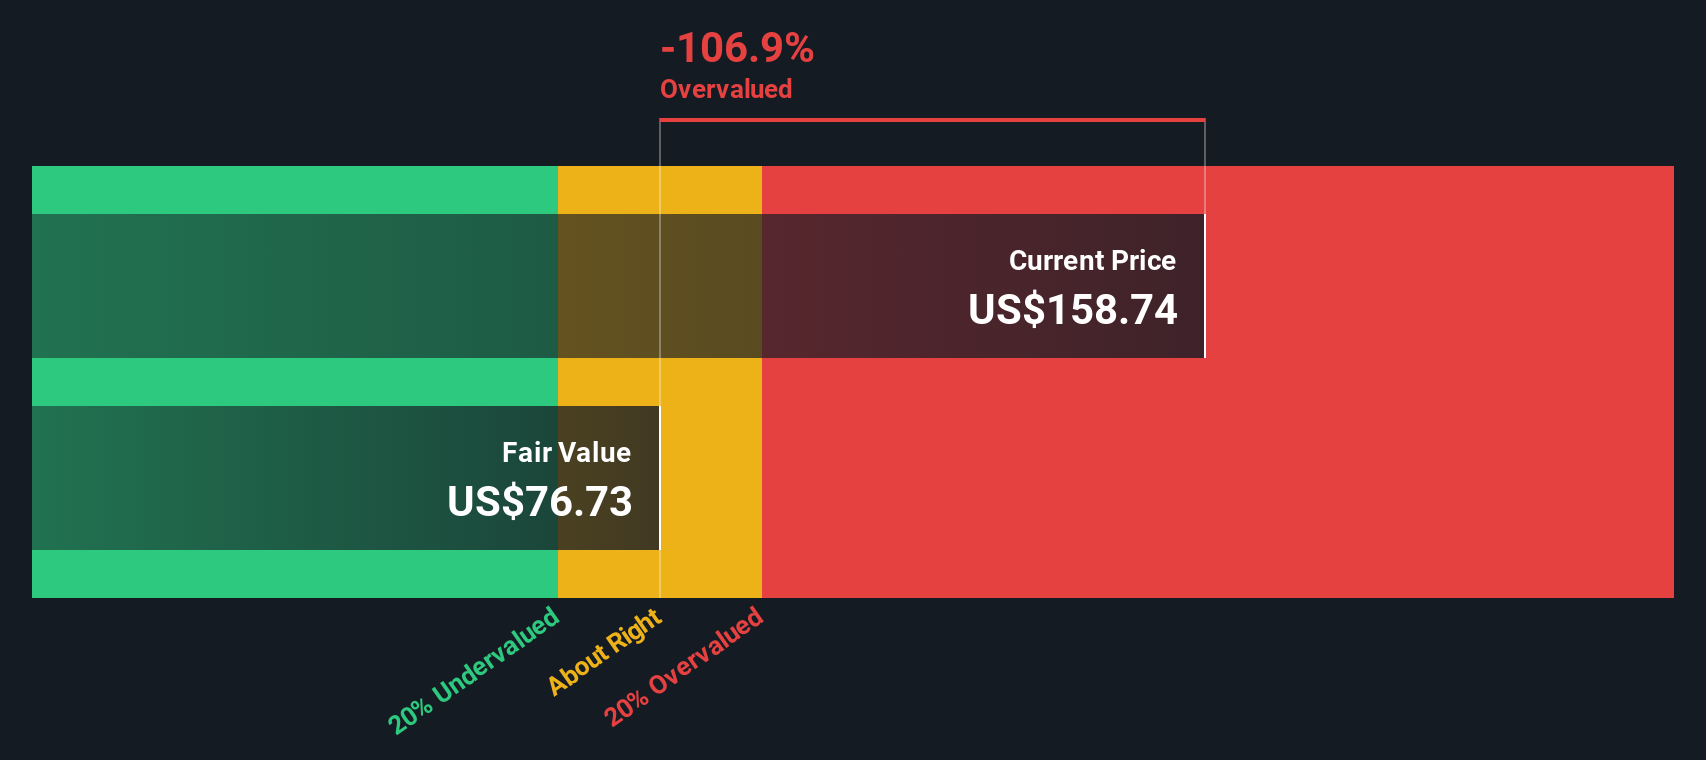
Using a 2 Stage Free Cash Flow to Equity DCF, the model arrives at an intrinsic value of about $72.50 per share. Compared to the current market price, this implies the stock is roughly 150.7% overvalued, suggesting that investors are already paying up for very optimistic growth and profitability assumptions.
Result: OVERVALUED
Our Discounted Cash Flow (DCF) analysis suggests Palantir Technologies may be overvalued by 150.7%. Discover 908 undervalued stocks or create your own screener to find better value opportunities.
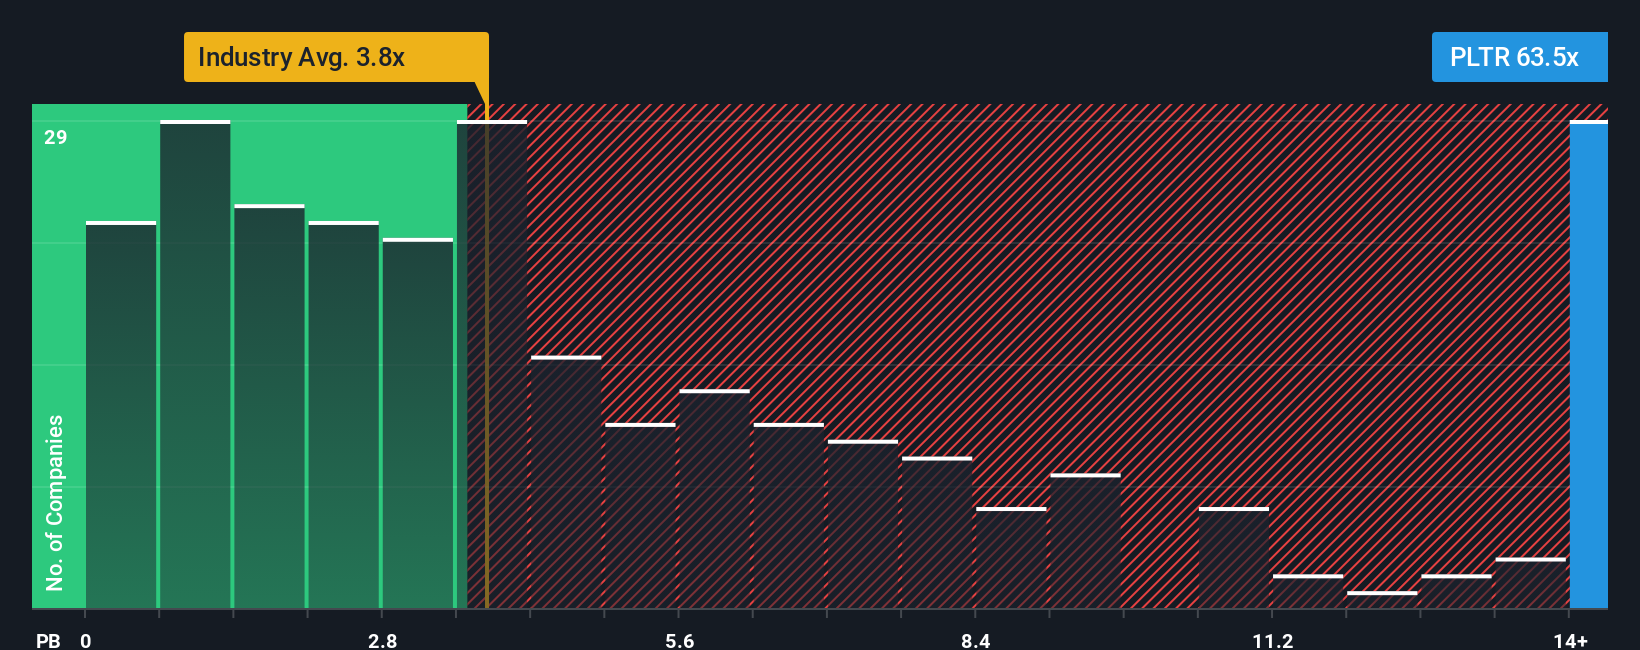
Approach 2: Palantir Technologies Price vs Book
For profitable, established software companies, the price to book ratio is a useful way to gauge how much of a premium investors are paying over the company’s net assets, especially when those assets include valuable, scalable software platforms. A higher multiple can be justified when investors expect strong, durable growth and see relatively low risk, while a lower multiple is typical for slower growing or more volatile businesses.
Palantir currently trades at about 65.73x book value, which is not only far above the broader Software industry average of roughly 3.40x, but also well ahead of the peer group average of around 46.18x. To put those numbers into better context, Simply Wall St uses a proprietary “Fair Ratio” metric, which estimates what an appropriate price to book multiple should be after accounting for Palantir’s specific earnings growth outlook, profitability, risk profile, market cap and industry dynamics.
This Fair Ratio approach is more robust than a simple comparison to peers or industry averages because it adjusts for how unique Palantir is on factors like margins, growth runway and business risk. While the exact Fair Ratio is not provided here, Palantir’s current 65.73x multiple sits meaningfully above both peers and the wider industry, which suggests the shares are priced for exceptionally optimistic outcomes.
Result: OVERVALUED
PB ratios tell one story, but what if the real opportunity lies elsewhere? Discover 1452 companies where insiders are betting big on explosive growth.
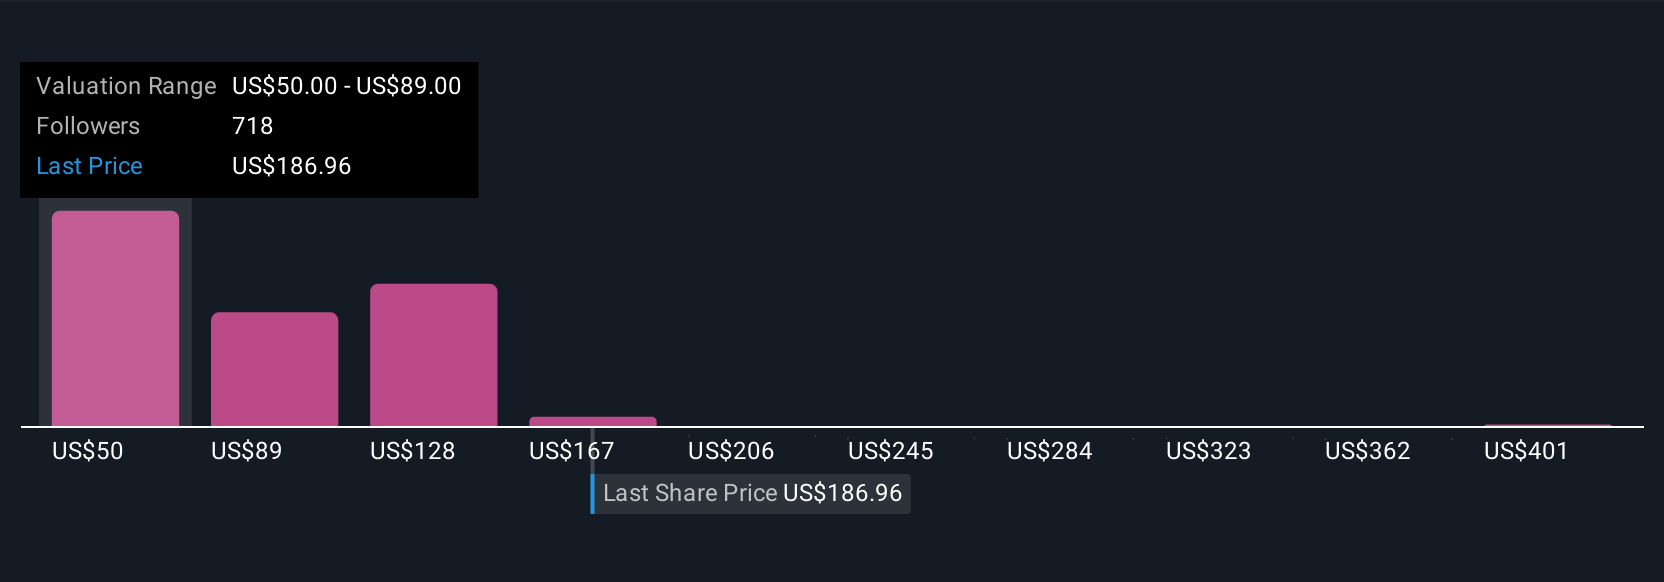
Upgrade Your Decision Making: Choose your Palantir Technologies Narrative
Earlier we mentioned that there is an even better way to understand valuation, so let us introduce you to Narratives, a simple way to connect your view of a company with the numbers behind it.
A Narrative is the story you believe about a business, turned into a structured forecast, by linking your assumptions for future revenue, earnings and margins to an overall fair value that you think makes sense for the stock.
On Simply Wall St, Narratives live inside the Community page, where millions of investors can turn their perspectives into transparent, numbers based models that clearly show how a company’s story translates into a valuation.
Once you have a Narrative, the platform compares your Fair Value to the current share price. This can help you decide whether Palantir looks like a buy, a hold or a sell today, and automatically updates that view when new earnings, news or guidance changes your assumptions.
For example, one bullish Palantir Narrative on Simply Wall St currently points to a fair value of about $154 per share. A more cautious view suggests closer to $66, showing how different stories about the same company can lead to very different decisions.
Do you think there's more to the story for Palantir Technologies? Head over to our Community to see what others are saying!
This article by Simply Wall St is general in nature. We provide commentary based on historical data and analyst forecasts only using an unbiased methodology and our articles are not intended to be financial advice. It does not constitute a recommendation to buy or sell any stock, and does not take account of your objectives, or your financial situation. We aim to bring you long-term focused analysis driven by fundamental data. Note that our analysis may not factor in the latest price-sensitive company announcements or qualitative material. Simply Wall St has no position in any stocks mentioned.
Have feedback on this article? Concerned about the content? Get in touch with us directly. Alternatively, email editorial-team@simplywallst.com