
- PREMIUM
- LIVE QUOTES
- INSTITUTION
 Index Options
 State Street
 CME Group
 Nasdaq
 Cboe
Cboe TradingView
 Wall Street Journal
Institutional investors may adopt severe steps after CAR Group Limited's (ASX:CAR) latest 6.2% drop adds to a year losses
Key Insights
- Institutions' substantial holdings in CAR Group implies that they have significant influence over the company's share price
- The top 25 shareholders own 50% of the company
- Using data from analyst forecasts alongside ownership research, one can better assess the future performance of a company
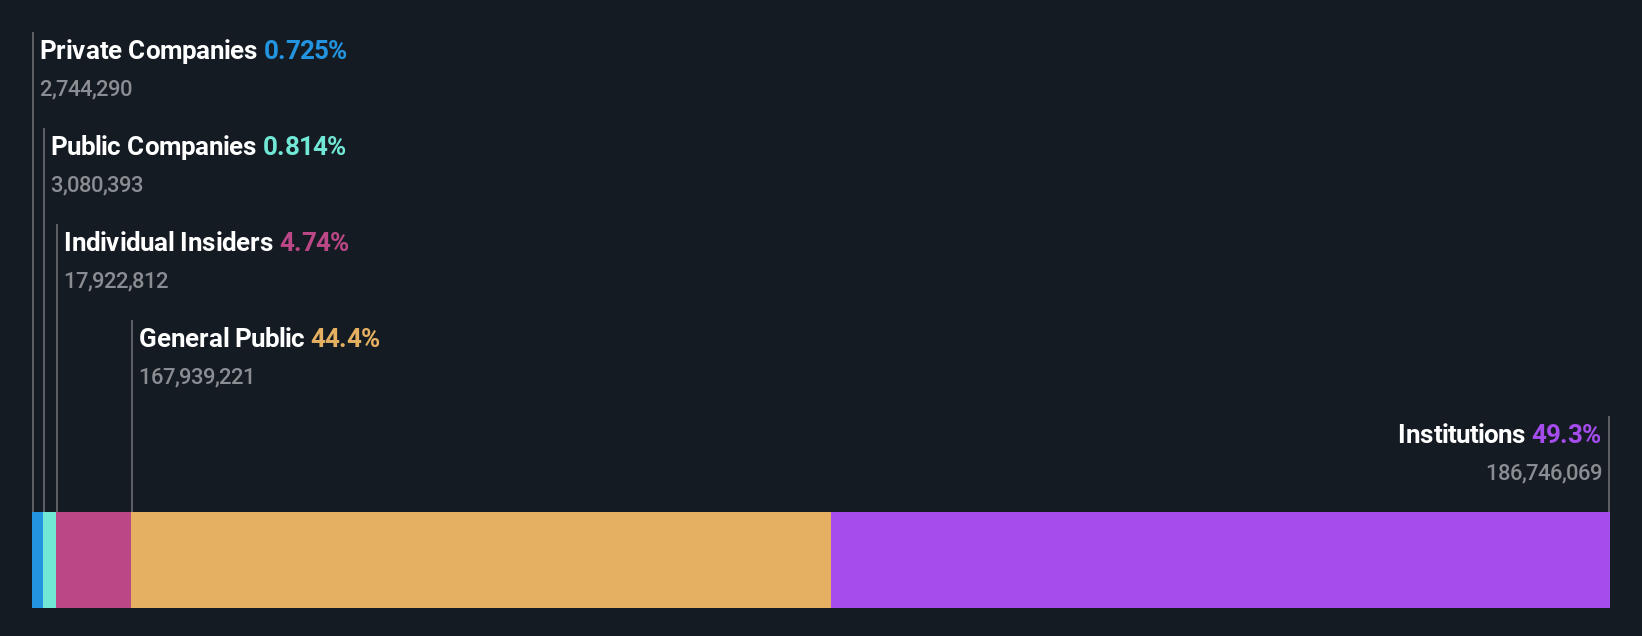
To get a sense of who is truly in control of CAR Group Limited (ASX:CAR), it is important to understand the ownership structure of the business. We can see that institutions own the lion's share in the company with 49% ownership. That is, the group stands to benefit the most if the stock rises (or lose the most if there is a downturn).
As a result, institutional investors endured the highest losses last week after market cap fell by AU$814m. Needless to say, the recent loss which further adds to the one-year loss to shareholders of 17% might not go down well especially with this category of shareholders. Also referred to as "smart money", institutions have a lot of sway over how a stock's price moves. As a result, if the decline continues, institutional investors may be pressured to sell CAR Group which might hurt individual investors.
Let's delve deeper into each type of owner of CAR Group, beginning with the chart below.
Check out our latest analysis for CAR Group
What Does The Institutional Ownership Tell Us About CAR Group?
Institutions typically measure themselves against a benchmark when reporting to their own investors, so they often become more enthusiastic about a stock once it's included in a major index. We would expect most companies to have some institutions on the register, especially if they are growing.
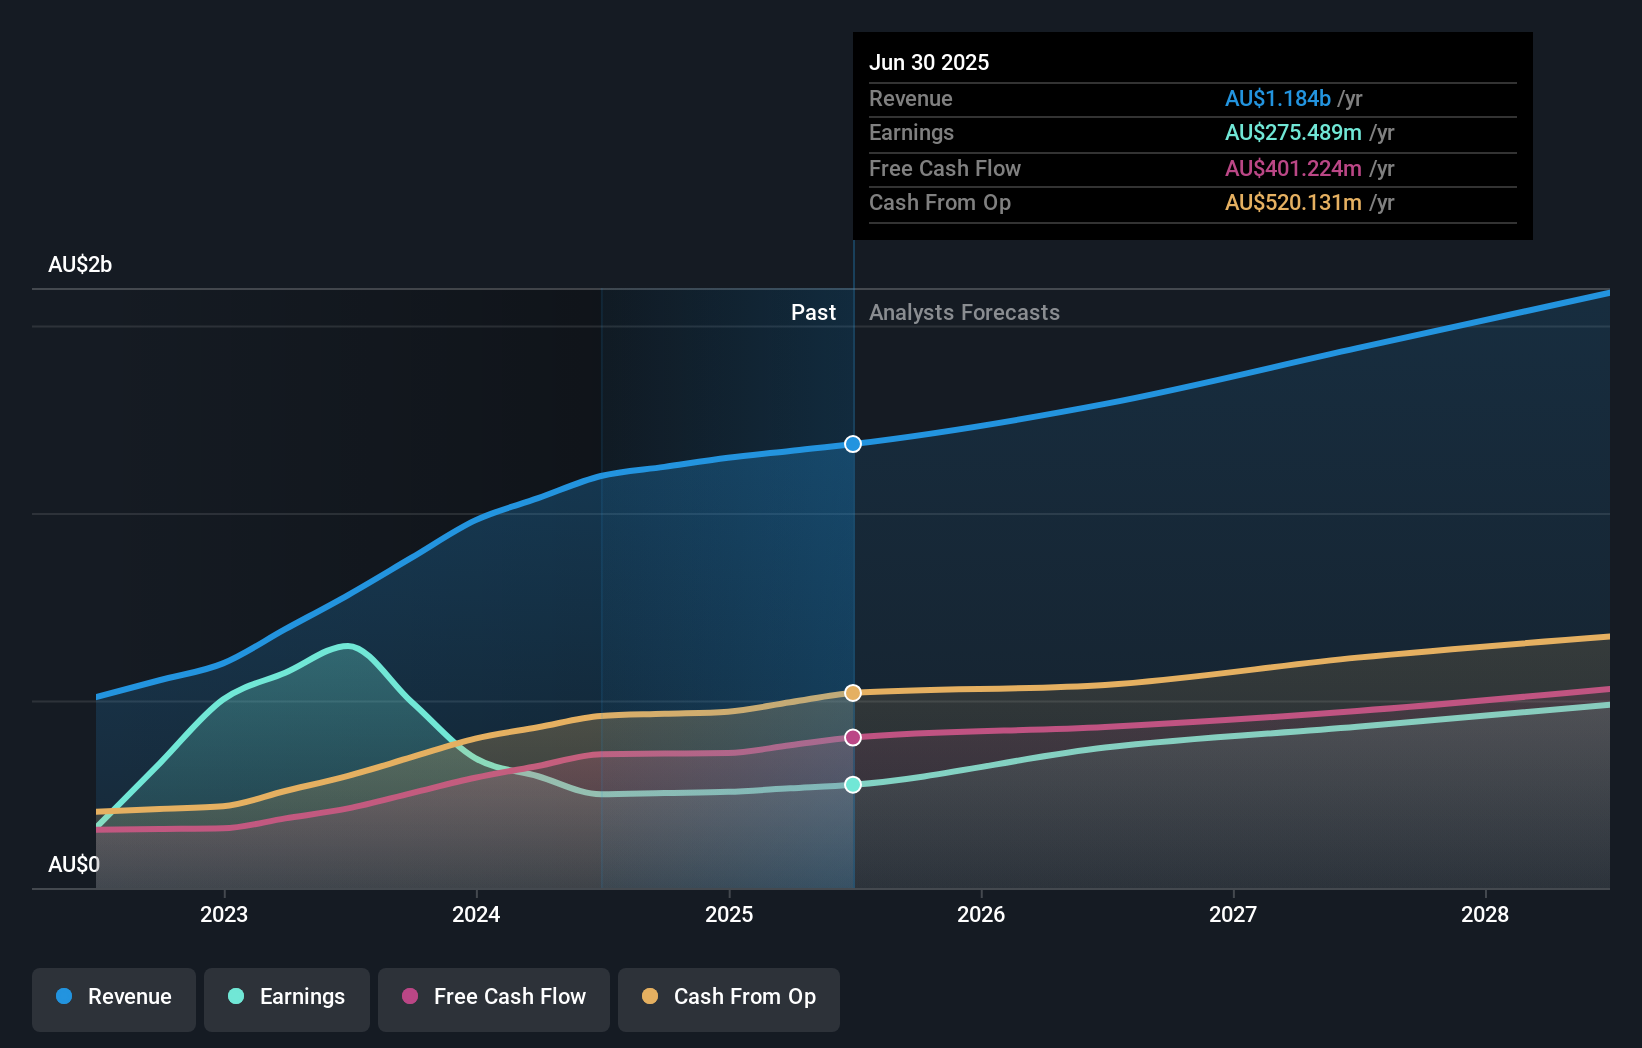
As you can see, institutional investors have a fair amount of stake in CAR Group. This can indicate that the company has a certain degree of credibility in the investment community. However, it is best to be wary of relying on the supposed validation that comes with institutional investors. They too, get it wrong sometimes. When multiple institutions own a stock, there's always a risk that they are in a 'crowded trade'. When such a trade goes wrong, multiple parties may compete to sell stock fast. This risk is higher in a company without a history of growth. You can see CAR Group's historic earnings and revenue below, but keep in mind there's always more to the story.
We note that hedge funds don't have a meaningful investment in CAR Group. State Street Global Advisors, Inc. is currently the largest shareholder, with 7.2% of shares outstanding. For context, the second largest shareholder holds about 6.2% of the shares outstanding, followed by an ownership of 6.0% by the third-largest shareholder.
Our studies suggest that the top 25 shareholders collectively control less than half of the company's shares, meaning that the company's shares are widely disseminated and there is no dominant shareholder.
Researching institutional ownership is a good way to gauge and filter a stock's expected performance. The same can be achieved by studying analyst sentiments. Quite a few analysts cover the stock, so you could look into forecast growth quite easily.
Insider Ownership Of CAR Group
While the precise definition of an insider can be subjective, almost everyone considers board members to be insiders. The company management answer to the board and the latter should represent the interests of shareholders. Notably, sometimes top-level managers are on the board themselves.
I generally consider insider ownership to be a good thing. However, on some occasions it makes it more difficult for other shareholders to hold the board accountable for decisions.
We can see that insiders own shares in CAR Group Limited. It is a very large company, and board members collectively own AU$585m worth of shares (at current prices). Most would say this shows a good alignment of interests between shareholders and the board. Still, it might be worth checking if those insiders have been selling.
General Public Ownership
The general public, who are usually individual investors, hold a 44% stake in CAR Group. This size of ownership, while considerable, may not be enough to change company policy if the decision is not in sync with other large shareholders.
Next Steps:
I find it very interesting to look at who exactly owns a company. But to truly gain insight, we need to consider other information, too. Case in point: We've spotted 1 warning sign for CAR Group you should be aware of.
Ultimately the future is most important. You can access this free report on analyst forecasts for the company.
NB: Figures in this article are calculated using data from the last twelve months, which refer to the 12-month period ending on the last date of the month the financial statement is dated. This may not be consistent with full year annual report figures.
Have feedback on this article? Concerned about the content? Get in touch with us directly. Alternatively, email editorial-team (at) simplywallst.com.
This article by Simply Wall St is general in nature. We provide commentary based on historical data and analyst forecasts only using an unbiased methodology and our articles are not intended to be financial advice. It does not constitute a recommendation to buy or sell any stock, and does not take account of your objectives, or your financial situation. We aim to bring you long-term focused analysis driven by fundamental data. Note that our analysis may not factor in the latest price-sensitive company announcements or qualitative material. Simply Wall St has no position in any stocks mentioned.