
- PREMIUM
- LIVE QUOTES
- INSTITUTION
 Index Options
 State Street
 CME Group
 Nasdaq
 Cboe
Cboe TradingView
 Wall Street Journal
Is NVIDIA’s AI Chip Dominance Still Attractive After a 974% Three Year Surge?
- Wondering if NVIDIA is still worth buying after its monster run, or if the real upside is already priced in? You are in the right place.
- The stock has pulled back about 6.6% over the last month despite being up 3.1% in the past week. It is still sitting on huge gains of 31.9% year to date and 28.1% over the last year, after a staggering 974.0% 3 year and 1305.7% 5 year climb.
- Recent headlines have centered on NVIDIA's dominant position in AI data center chips and expanding partnerships with major cloud providers. These developments have reinforced the narrative that it is the backbone of the current AI investment cycle. At the same time, regulators and governments have been scrutinizing advanced chip exports and competition dynamics, adding a layer of long term uncertainty that can amplify short term price swings.
- Despite the hype, NVIDIA only scores 2/6 on our valuation checks. Next we will break down what that actually means across different valuation approaches and later explore a more nuanced way to think about what the market is really pricing in.
NVIDIA scores just 2/6 on our valuation checks. See what other red flags we found in the full valuation breakdown.
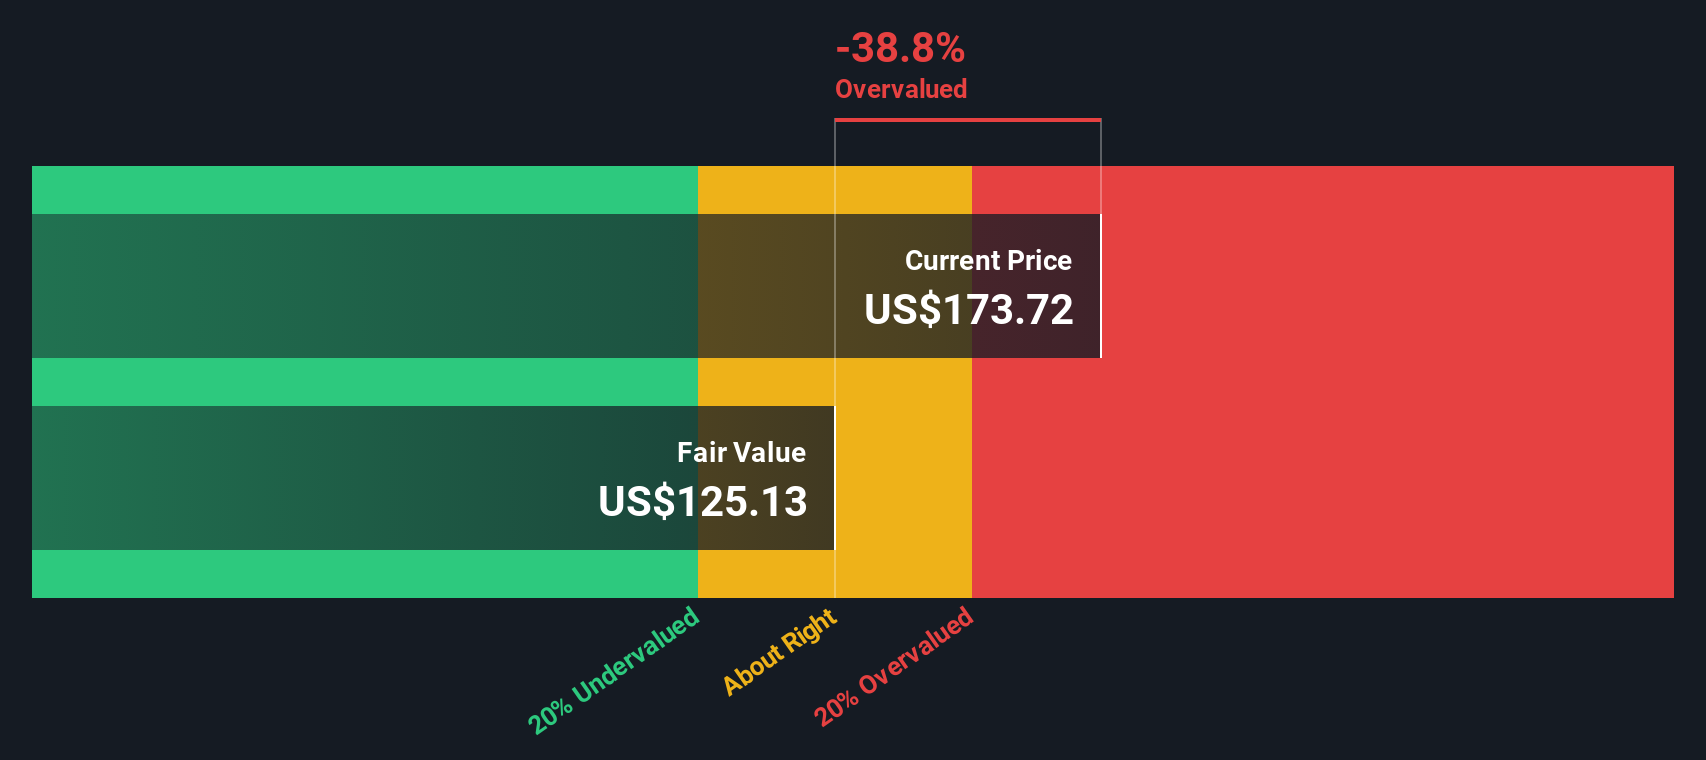
Approach 1: NVIDIA Discounted Cash Flow (DCF) Analysis
A Discounted Cash Flow model estimates what a business is worth by projecting its future cash flows and then discounting them back to today, using a required rate of return. For NVIDIA, the model uses a 2 Stage Free Cash Flow to Equity framework, based on cash flow projections in $.
NVIDIA generated about $77.96 billion in free cash flow over the last twelve months, a massive base that analysts expect to keep growing. By 2030, projected free cash flow climbs to roughly $287.49 billion, with interim years stepping up sharply as AI demand boosts data center and platform revenues. Beyond the first five years, Simply Wall St extrapolates growth at moderating rates to avoid assuming hyper growth indefinitely.
After discounting these future cash flows back to today, the model arrives at an intrinsic value of roughly $163.83 per share. With the DCF indicating the stock is about 11.3% overvalued relative to its current price, NVIDIA screens as expensive on this cash flow based lens rather than a bargain.
Result: OVERVALUED
Our Discounted Cash Flow (DCF) analysis suggests NVIDIA may be overvalued by 11.3%. Discover 906 undervalued stocks or create your own screener to find better value opportunities.
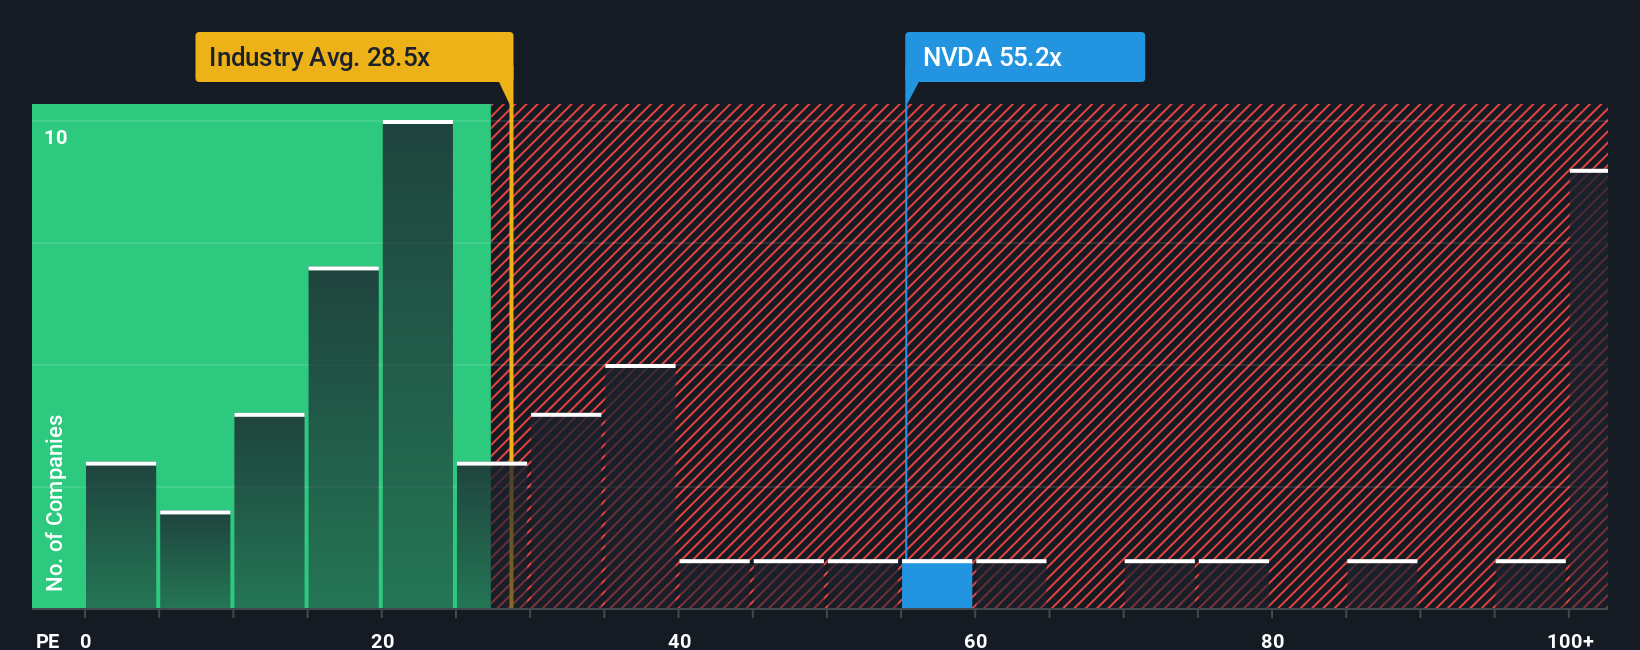
Approach 2: NVIDIA Price vs Earnings
For established, profitable companies like NVIDIA, the price to earnings ratio is a practical way to gauge valuation, because it links what investors pay today to the profits the business is already generating. The higher the expected growth and the lower the perceived risk, the higher a normal or fair PE ratio investors are usually willing to accept.
NVIDIA currently trades on a PE of about 44.7x, which is above the broader semiconductor industry average of roughly 38.0x but below the peer group average near 69.0x. On the surface, that suggests the market is pricing in strong growth, but not as aggressively as some high flying chip names.
Simply Wall St’s Fair Ratio framework estimates that, given NVIDIA’s earnings growth profile, margins, industry, market cap and risk factors, a PE of around 58.1x would be appropriate. This Fair Ratio is more insightful than simple peer or industry comparisons because it adjusts for company specific quality and growth rather than assuming all chipmakers deserve the same multiple. With the current PE of 44.7x sitting below the 58.1x Fair Ratio, this lens points to NVIDIA looking undervalued on an earnings multiple basis.
Result: UNDERVALUED
PE ratios tell one story, but what if the real opportunity lies elsewhere? Discover 1442 companies where insiders are betting big on explosive growth.
Upgrade Your Decision Making: Choose your NVIDIA Narrative
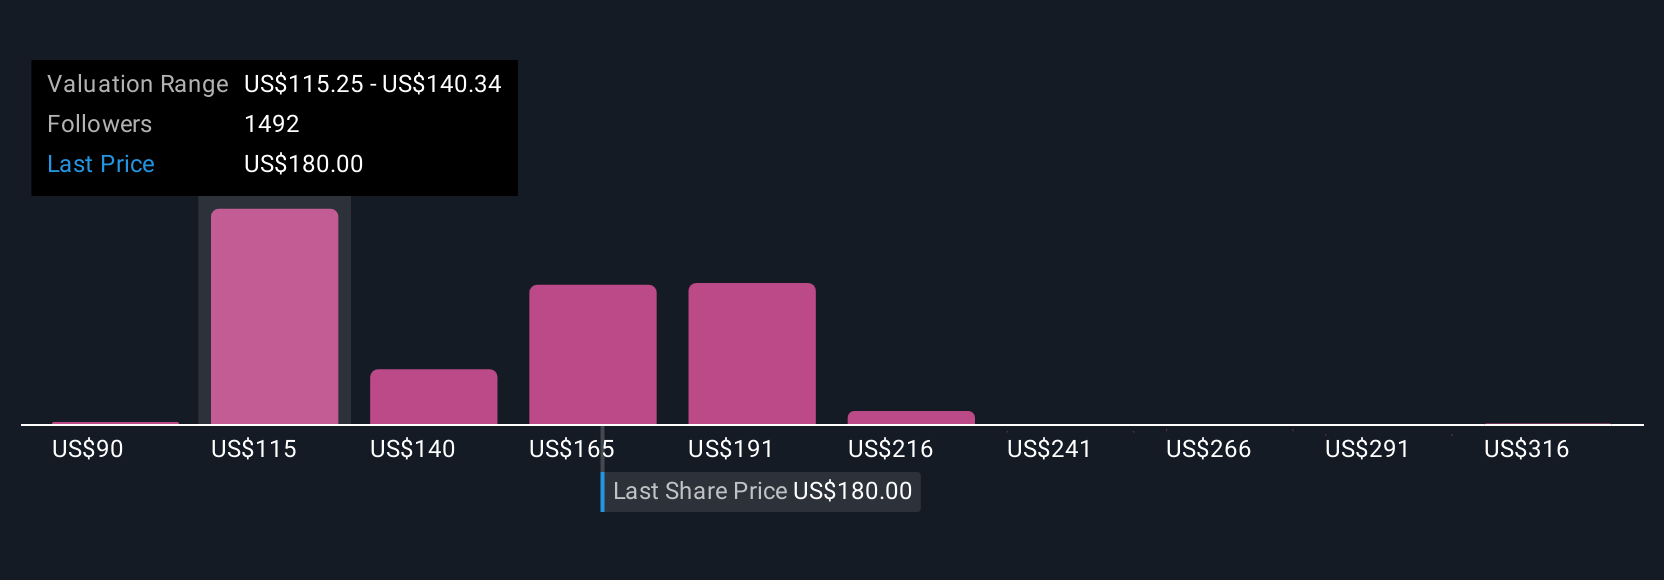
Earlier we mentioned that there is an even better way to understand valuation, so let's introduce you to Narratives, a simple way to connect your view of NVIDIA's story to concrete numbers like future revenue, earnings, margins and ultimately a fair value estimate. A Narrative on Simply Wall St is your personal scenario for a company, where you spell out how you think its competitive position, growth drivers and risks will play out, and the platform automatically turns that story into a full financial forecast and fair value. You can then compare this to the current share price to decide whether NVIDIA looks like a buy, hold or sell. Narratives are easy to use and live inside the Community page that millions of investors already visit. They update dynamically whenever new earnings, news or estimates come in, so your story and valuation stay current without you needing to rebuild a model from scratch. For example, one NVIDIA Narrative on the platform currently implies a fair value near $345 per share, while another sits closer to $90, showing how different, clearly defined stories about AI growth, competition and margins can lead to very different but transparent valuation outcomes.
For NVIDIA however we'll make it really easy for you with previews of two leading NVIDIA Narratives:
Fair value: $250.39 per share
Implied undervaluation vs current price: ((250.39 - 182.41) / 250.39) ≈ 27.2%
Expected annual revenue growth: 30.8%
- Views NVIDIA as the core infrastructure provider for a multi year global AI buildout, with hyperscalers, sovereigns and enterprises driving sustained, diversified demand.
- Assumes continuous platform leadership through Blackwell, Rubin and full stack hardware plus software that deepens customer lock in and keeps margins structurally high.
- Argues that, even after factoring in geopolitical, supply chain and vertical integration risks, the stock still offers upside to a higher earnings base by 2028 and a premium but reasonable future PE.
Fair value: $90.15 per share
Implied overvaluation vs current price: ((182.41 - 90.15) / 90.15) ≈ 102.3%
Expected annual revenue growth: 15.9%
- Argues NVIDIA is priced to perfection, with today’s valuation embedding extremely optimistic assumptions about long term AI dominance and margin sustainability.
- Highlights rising competitive and technological threats, from hyperscaler in house chips and specialist ASICs to more efficient software and open source stacks that could weaken CUDA and GPU demand.
- Builds a DCF around slower growth, margin compression and a much lower future PE multiple, leading to a fair value that is roughly half the current share price and far below many bullish targets.
Do you think there's more to the story for NVIDIA? Head over to our Community to see what others are saying!
This article by Simply Wall St is general in nature. We provide commentary based on historical data and analyst forecasts only using an unbiased methodology and our articles are not intended to be financial advice. It does not constitute a recommendation to buy or sell any stock, and does not take account of your objectives, or your financial situation. We aim to bring you long-term focused analysis driven by fundamental data. Note that our analysis may not factor in the latest price-sensitive company announcements or qualitative material. Simply Wall St has no position in any stocks mentioned.
Have feedback on this article? Concerned about the content? Get in touch with us directly. Alternatively, email editorial-team@simplywallst.com