
- PREMIUM
- LIVE QUOTES
- INSTITUTION
 Index Options
 State Street
 CME Group
 Nasdaq
 Cboe
Cboe TradingView
 Wall Street Journal
Has Voyager Technologies Run Ahead of Itself After Recent Sensing and Automation Partnerships?
- Wondering if Voyager Technologies at $23.75 is a beaten down bargain or a value trap? This article will walk you through what the numbers are really saying about the stock.
- Despite being down 57.9% year to date and 9.7% over the last month, the share price has bounced 5.6% in the past week, hinting that some investors might be testing the waters again.
- Recent headlines have focused on Voyager Technologies doubling down on next generation sensing and automation partnerships, as well as expanding pilot programs with industrial and infrastructure customers. This helps explain why sentiment has started to stabilize. At the same time, broader sector volatility in capital goods and tech hardware has amplified every shift in expectations around its long term growth story.
- Right now, Voyager Technologies scores just 0/6 on our undervaluation checks. We will break down what traditional valuation approaches say about that score and then finish with a more powerful way to think about the company’s real long term value.
Voyager Technologies scores just 0/6 on our valuation checks. See what other red flags we found in the full valuation breakdown.
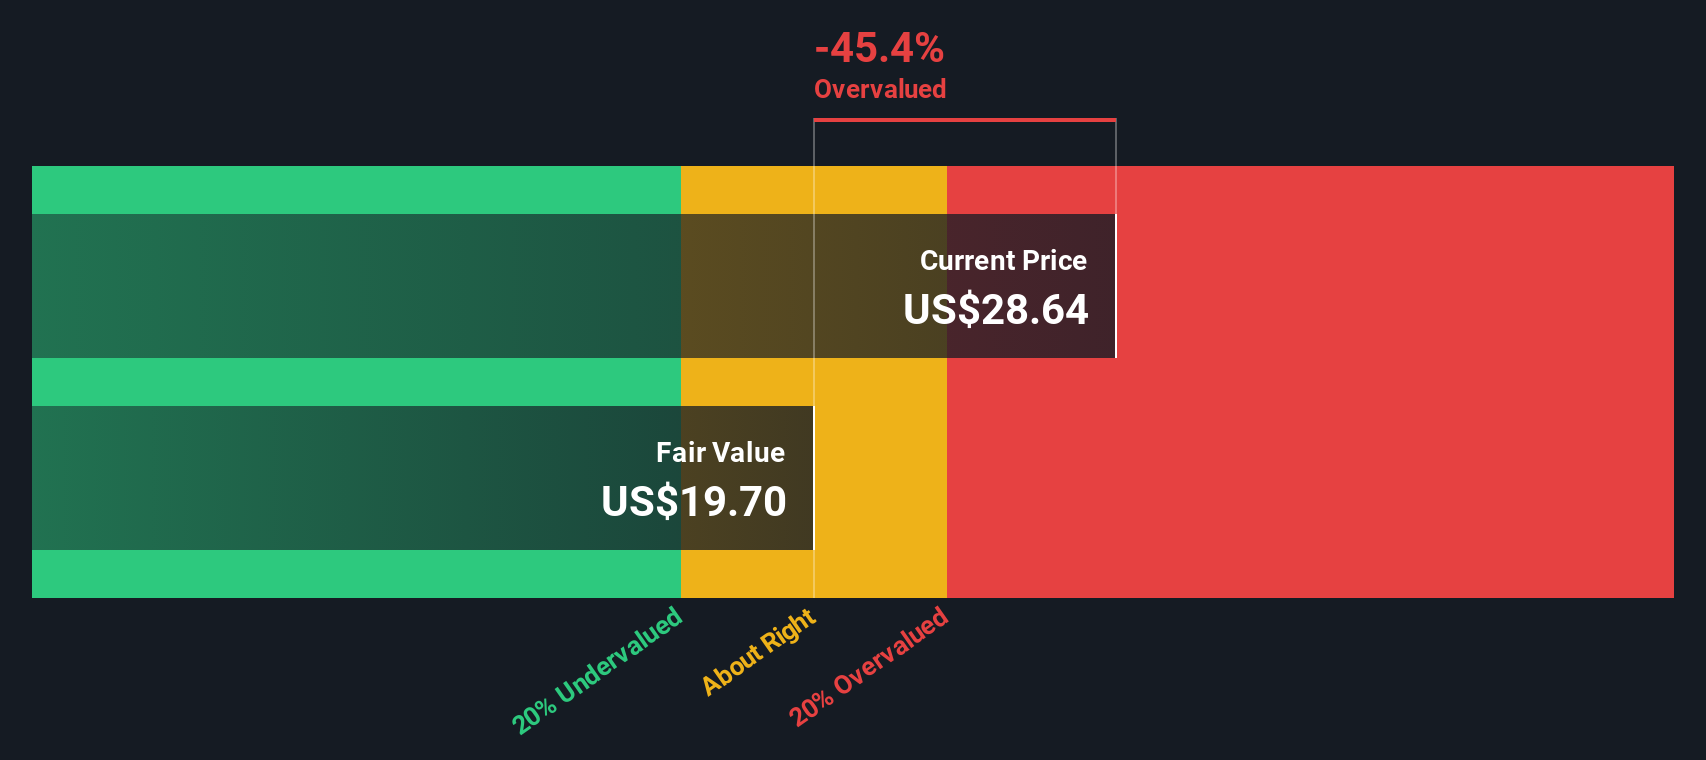
Approach 1: Voyager Technologies Discounted Cash Flow (DCF) Analysis
A Discounted Cash Flow model estimates what a company is worth by projecting its future cash flows and discounting them back to today, so that all those future dollars are expressed in current $ terms.
For Voyager Technologies, the 2 Stage Free Cash Flow to Equity model starts from last twelve month Free Cash Flow of about $51.5 Million outflow, then uses analyst forecasts and extrapolations to map a path back to positive territory. Projections in the model show Free Cash Flow remaining negative through 2027 before turning positive, reaching around $90 Million by 2035 as growth gradually normalizes.
Aggregating and discounting these cash flows, the model arrives at an estimated intrinsic value of roughly $16.77 per share. With the stock trading near $23.75, the DCF output implies the shares are about 41.6% above that intrinsic value estimate and reflects an assumption that the market is already pricing in a very optimistic improvement in cash generation.
Result: OVERVALUED
Our Discounted Cash Flow (DCF) analysis suggests Voyager Technologies may be overvalued by 41.6%. Discover 906 undervalued stocks or create your own screener to find better value opportunities.
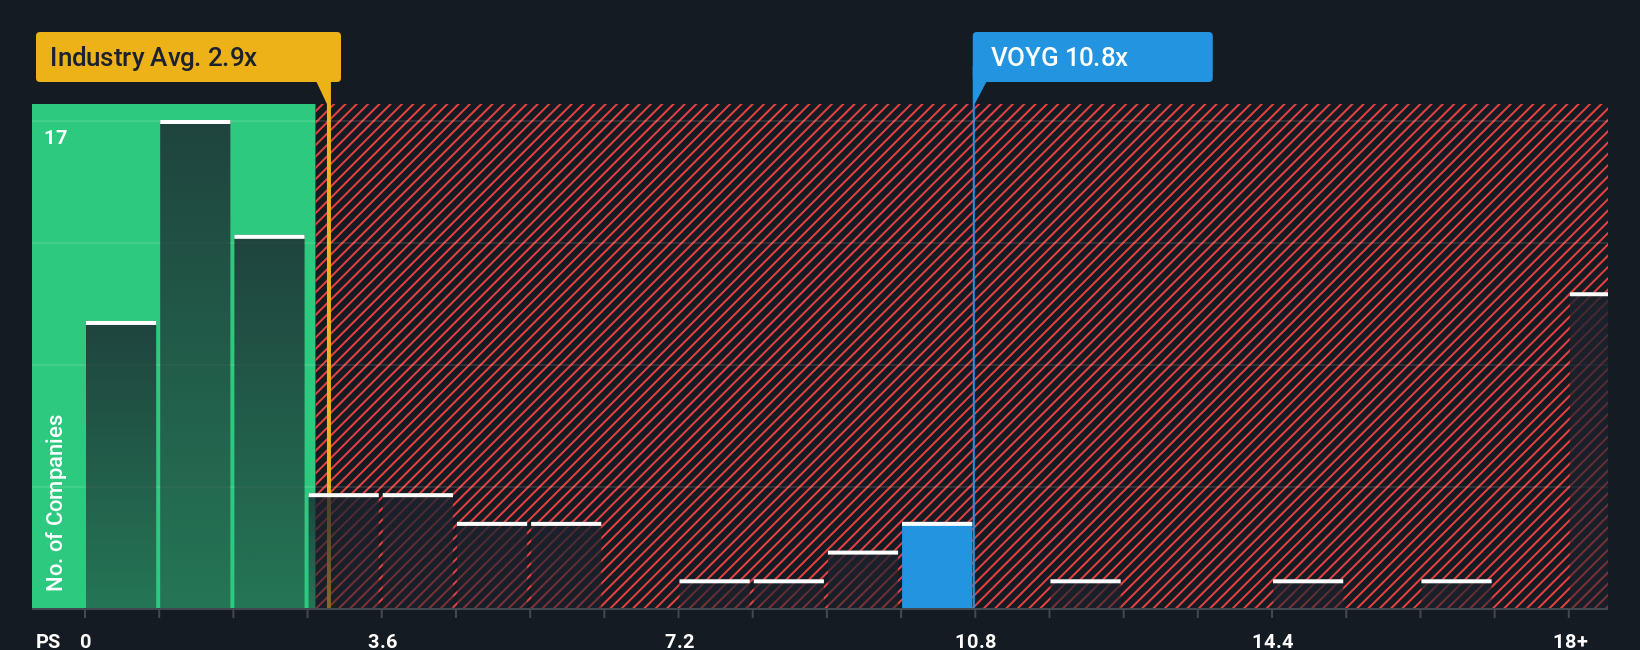
Approach 2: Voyager Technologies Price vs Sales
For growth focused businesses that are not yet consistently profitable, the price to sales ratio is often the cleanest way to compare what investors are paying for each dollar of revenue. It sidesteps the noise from volatile earnings while still reflecting how the market values the company’s commercial traction.
In practice, higher growth and lower risk usually justify a richer sales multiple, while slower or more uncertain growth tends to pull a normal range lower. Voyager Technologies currently trades on about 8.98x sales, which is well above both the Aerospace and Defense industry average of roughly 2.98x and the peer group average of around 2.74x. Simply Wall St’s Fair Ratio framework estimates a more appropriate level of about 5.00x for Voyager, based on its growth outlook, profit structure, size and risk profile.
Because the Fair Ratio explicitly adjusts for factors like revenue growth, margins, industry dynamics, market cap and company specific risks, it gives a more tailored benchmark than simple peer or sector comparisons. Lining that up against the current 8.98x sales suggests the market is pricing Voyager at a premium that is difficult to justify on fundamentals alone.
Result: OVERVALUED
PS ratios tell one story, but what if the real opportunity lies elsewhere? Discover 1442 companies where insiders are betting big on explosive growth.
Upgrade Your Decision Making: Choose your Voyager Technologies Narrative
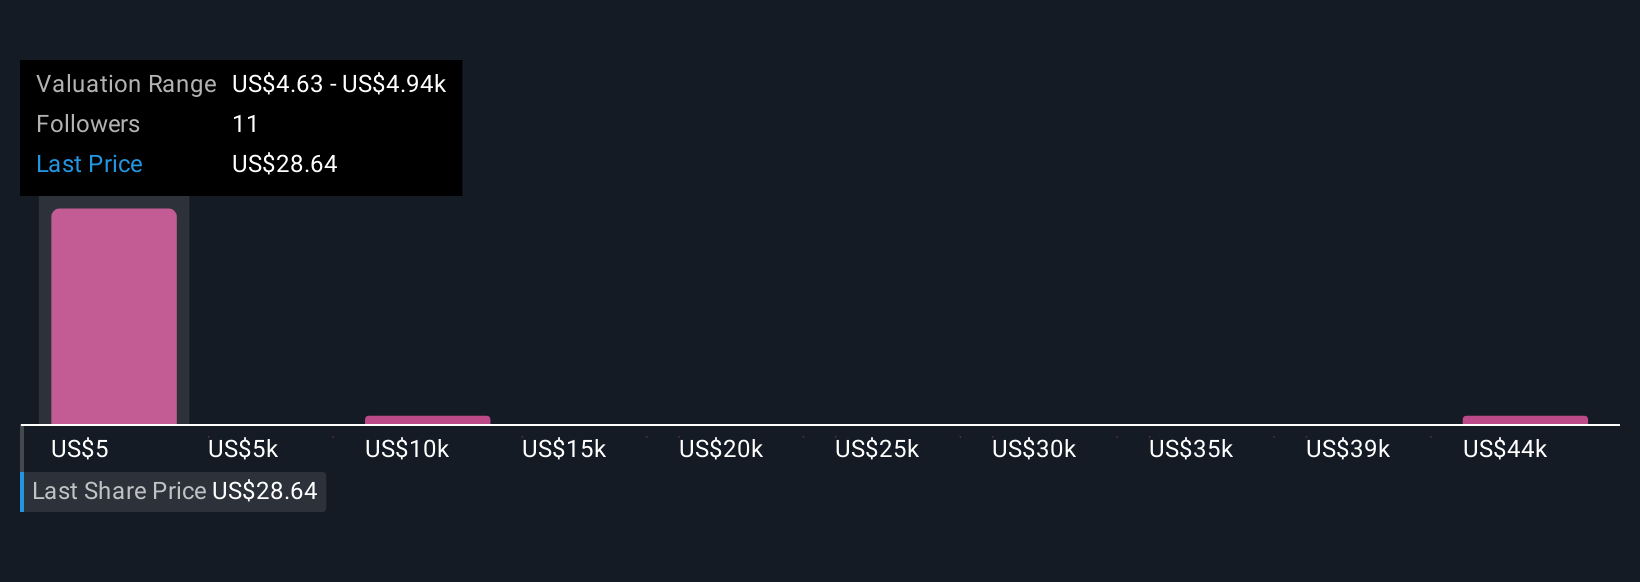
Earlier we mentioned that there is an even better way to understand valuation, so let us introduce you to Narratives, a simple way to attach your story about a company to the numbers you expect it to deliver. A Narrative is your view of Voyager Technologies future, where you spell out assumptions for revenue growth, profit margins and risk, then connect those assumptions to a financial forecast and, ultimately, to a fair value estimate. On Simply Wall St, Narratives live inside the Community page, where millions of investors can quickly build, share and compare these story driven valuation models without needing a spreadsheet. Narratives then aim to make the decision process clearer by lining up your Fair Value against today’s share price and updating automatically as new news, earnings results and guidance are released. For example, one Voyager Technologies Narrative might assume only modest growth and assign a low fair value, while another might expect rapid adoption of its sensing platforms and justify a far higher fair value than the current price.
Do you think there's more to the story for Voyager Technologies? Head over to our Community to see what others are saying!
This article by Simply Wall St is general in nature. We provide commentary based on historical data and analyst forecasts only using an unbiased methodology and our articles are not intended to be financial advice. It does not constitute a recommendation to buy or sell any stock, and does not take account of your objectives, or your financial situation. We aim to bring you long-term focused analysis driven by fundamental data. Note that our analysis may not factor in the latest price-sensitive company announcements or qualitative material. Simply Wall St has no position in any stocks mentioned.
Have feedback on this article? Concerned about the content? Get in touch with us directly. Alternatively, email editorial-team@simplywallst.com