
- PREMIUM
- LIVE QUOTES
- INSTITUTION
 Index Options
 State Street
 CME Group
 Nasdaq
 Cboe
Cboe TradingView
 Wall Street Journal
Pan American Silver (TSX:PAAS) Valuation After Major Exploration Results and Resource Expansion Update
Pan American Silver (TSX:PAAS) just dropped a dense exploration update, and that is what has the stock back on a lot of watchlists. Investors are weighing how these drill results could shift future production and valuation.
See our latest analysis for Pan American Silver.
Those exploration wins come on top of a packed news flow this year, and the market has noticed, with a roughly 29% 3 month share price return and a near doubling in 1 year total shareholder return, signaling strong momentum rather than a one off spike.
If these drill results have you rethinking growth potential in the space, it might be worth scanning fast growing stocks with high insider ownership to see what other under the radar stories are building steam.
With exploration metres surging, earnings growing and the share price nearly doubling in a year, is Pan American Silver still trading at a discount to its intrinsic value, or is the market already pricing in the next leg of growth?
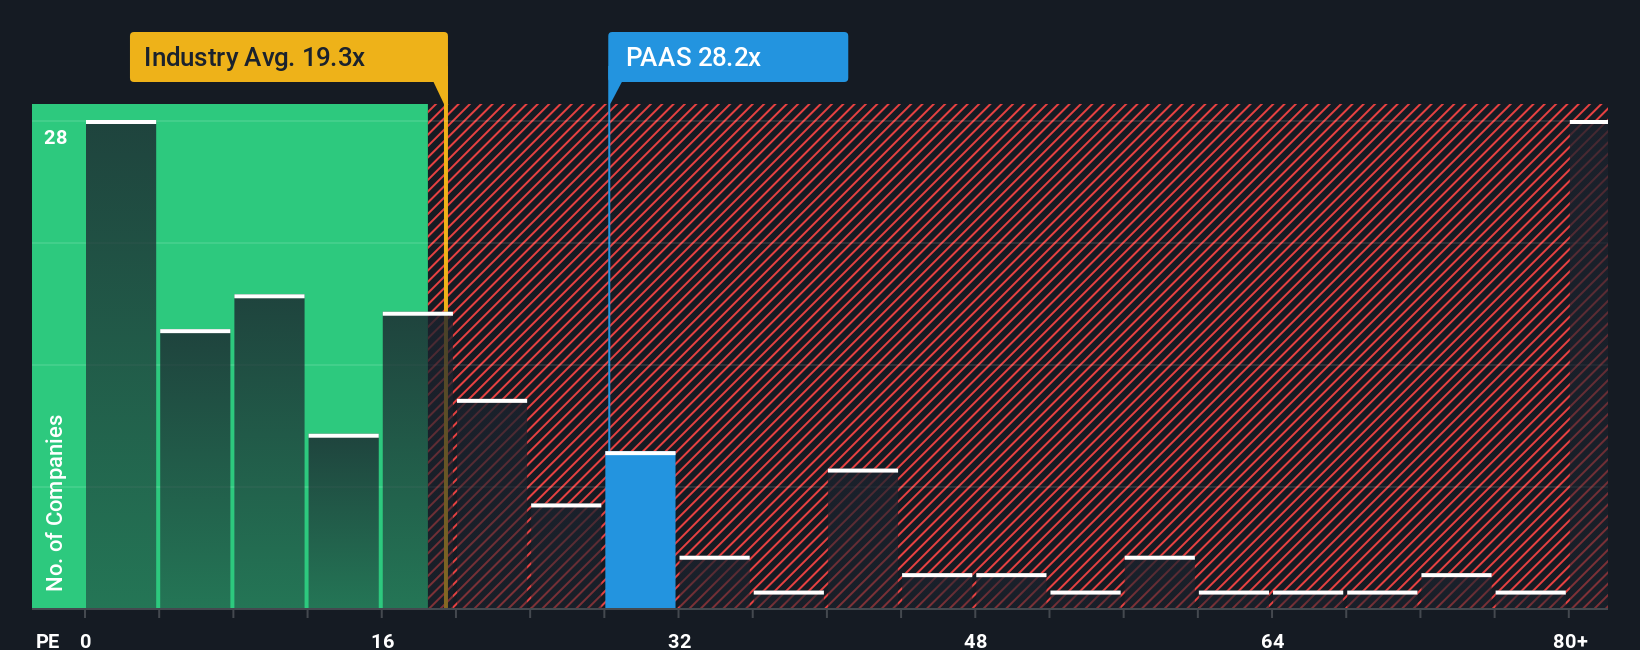
Price-to-Earnings of 29.5x: Is it justified?
Our DCF model estimates Pan American Silver’s fair value at roughly CA$141.56 per share, suggesting the stock is deeply undervalued versus the CA$61.36 last close.
The SWS DCF model projects the company’s future cash flows and then discounts them back to today using a required return. This effectively translates long term expectations into a single fair value figure. Because Pan American Silver has recently swung to profitability, with earnings forecast to grow at close to 28% annually and revenue expected to outpace the broader Canadian market, a cash flow based lens can capture that inflection more directly than backward looking metrics.
Against that backdrop, the current price to earnings ratio of 29.5 times screens expensive versus both the estimated fair price to earnings ratio of 26 times and the Canadian metals and mining industry average of 21.2 times, implying investors are already paying a premium for near term earnings. Yet compared with a peer group average multiple of 63.6 times, the same 29.5 times looks restrained and could have room to drift higher if the company delivers on its growth profile, especially if the market gradually re rates the stock toward the DCF implied value.
Look into how the SWS DCF model arrives at its fair value.
Result: Price-to-Earnings of 29.5x (UNDERVALUED)
However, risks remain, including execution setbacks at new projects or weaker metal prices, which could compress margins and challenge the current premium multiple.
Find out about the key risks to this Pan American Silver narrative.
Another View: What Do Ratios Really Say?
Looking at ratios alone tells a more cautious story. Pan American Silver trades at 29.5 times earnings, above the 26 times fair ratio our analysis points to and well ahead of the 21.2 times industry average. That premium may limit upside if sentiment or commodity prices cool.
See what the numbers say about this price — find out in our valuation breakdown.
Simply Wall St performs a discounted cash flow (DCF) on every stock in the world every day (check out Pan American Silver for example). We show the entire calculation in full. You can track the result in your watchlist or portfolio and be alerted when this changes, or use our stock screener to discover 906 undervalued stocks based on their cash flows. If you save a screener we even alert you when new companies match - so you never miss a potential opportunity.
Build Your Own Pan American Silver Narrative
If you see the story differently or want to dive into the numbers yourself, you can build a custom view in just minutes with Do it your way.
A great starting point for your Pan American Silver research is our analysis highlighting 3 key rewards and 2 important warning signs that could impact your investment decision.
Looking for more investment ideas?
If you stop here, you could miss stronger opportunities, so use the Simply Wall Street Screener to uncover fresh, high conviction stocks that match your strategy.
- Capture potential market mispricing by scanning these 906 undervalued stocks based on cash flows that pair compelling cash flow discounts with fundamentals that stand up to closer scrutiny.
- Ride long term innovation trends by targeting these 26 AI penny stocks positioned at the intersection of artificial intelligence demand and scalable business models.
- Strengthen your income stream by reviewing these 15 dividend stocks with yields > 3% that combine attractive yields with the financial resilience needed to sustain payouts.
This article by Simply Wall St is general in nature. We provide commentary based on historical data and analyst forecasts only using an unbiased methodology and our articles are not intended to be financial advice. It does not constitute a recommendation to buy or sell any stock, and does not take account of your objectives, or your financial situation. We aim to bring you long-term focused analysis driven by fundamental data. Note that our analysis may not factor in the latest price-sensitive company announcements or qualitative material. Simply Wall St has no position in any stocks mentioned.
Have feedback on this article? Concerned about the content? Get in touch with us directly. Alternatively, email editorial-team@simplywallst.com