
- PREMIUM
- LIVE QUOTES
- INSTITUTION
 Index Options
 State Street
 CME Group
 Nasdaq
 Cboe
Cboe TradingView
 Wall Street Journal
Does Peloton’s Turnaround Make Sense After a 94.5% Five Year Share Price Slide?
- Wondering if Peloton Interactive is finally a bargain or still a value trap at current levels? You are not alone in trying to make sense of where this stock really belongs.
- After years of steep losses, including a 94.5% slide over 5 years and a 35.9% drop in the last year alone, the recent 5.4% 7 day and 10.0% 30 day moves show investors are still wrestling with what Peloton is worth.
- Recent headlines have focused on Peloton's ongoing turnaround efforts, including cost cutting, product pivots, and an emphasis on partnerships to revive the brand and stabilize the business model. At the same time, lingering concerns about subscriber growth, hardware demand, and competition in connected fitness keep sentiment cautious and help explain the choppy share price.
- On our checklist of value signals, Peloton scores just 2 out of 6. This suggests that while there are pockets of undervaluation, the stock does not look cheap across the board. Next we will break down those valuation approaches in detail and, by the end of the article, look at a way to tie them together into a clearer investment narrative.
Peloton Interactive scores just 2/6 on our valuation checks. See what other red flags we found in the full valuation breakdown.
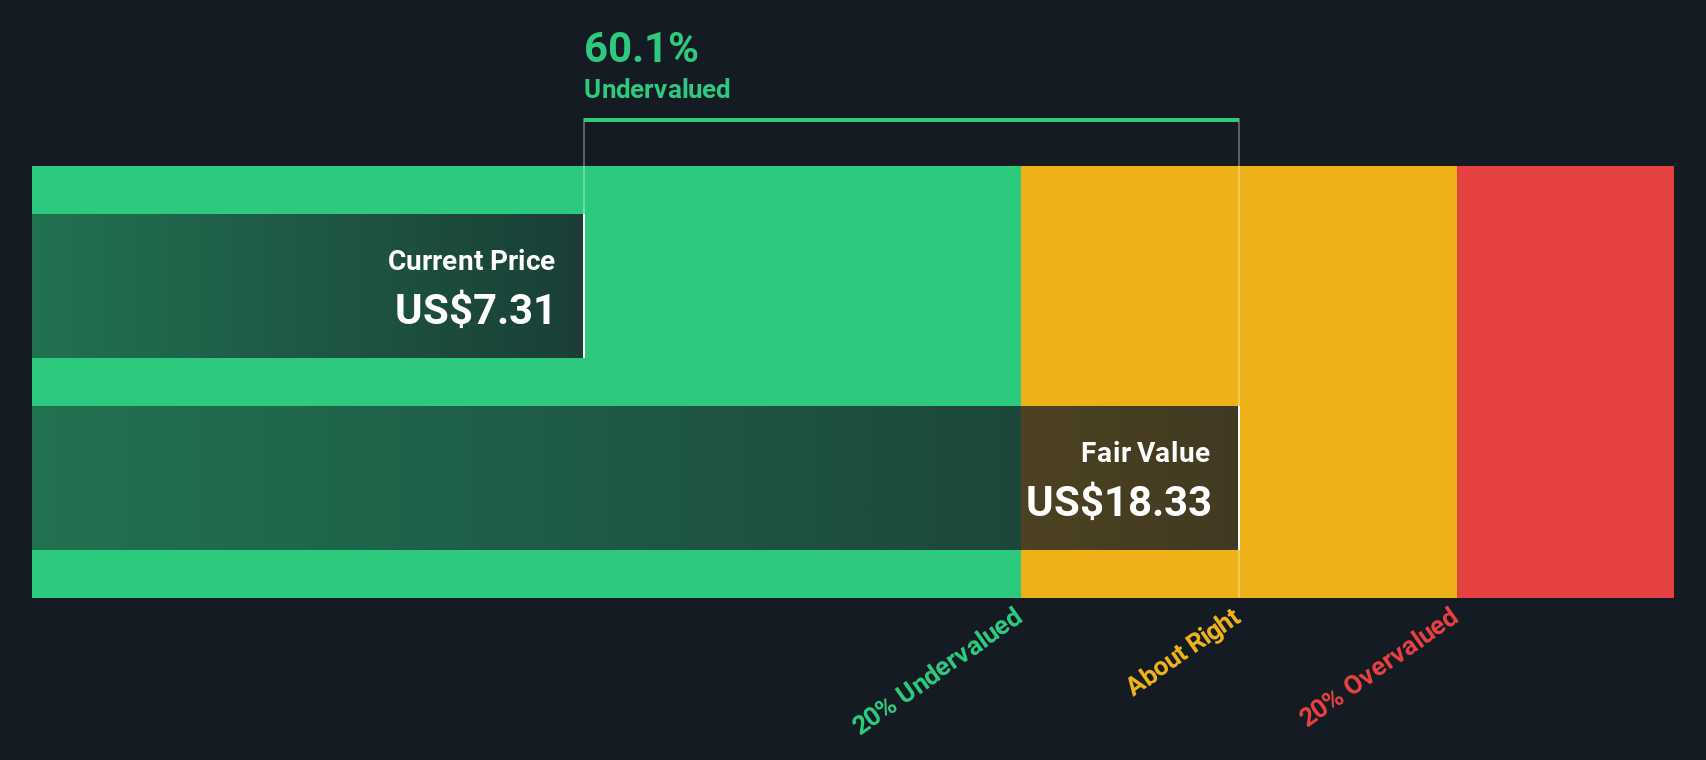
Approach 1: Peloton Interactive Discounted Cash Flow (DCF) Analysis
A Discounted Cash Flow model estimates what a business is worth by projecting its future cash flows and then discounting them back to today in $ terms. For Peloton Interactive, the model used is a 2 Stage Free Cash Flow to Equity approach, which factors in an initial high growth phase followed by a more mature period.
Peloton is currently generating roughly $370 Million in free cash flow, and analyst projections plus Simply Wall St extrapolations see this rising to around $481 Million by 2030, with intermediate years stepping up from about $257 Million in 2026 to over $616 Million by 2035 in the extended model. These cash flows are all translated into today’s dollars using a discount rate to reflect risk and the time value of money.
Putting these projections together, the model arrives at an intrinsic value of about $19.90 per share. Compared with the current market price, this implies the stock is roughly 67.7% undervalued. This indicates that investors may be heavily discounting Peloton’s turnaround potential.
Result: UNDERVALUED
Our Discounted Cash Flow (DCF) analysis suggests Peloton Interactive is undervalued by 67.7%. Track this in your watchlist or portfolio, or discover 906 more undervalued stocks based on cash flows.
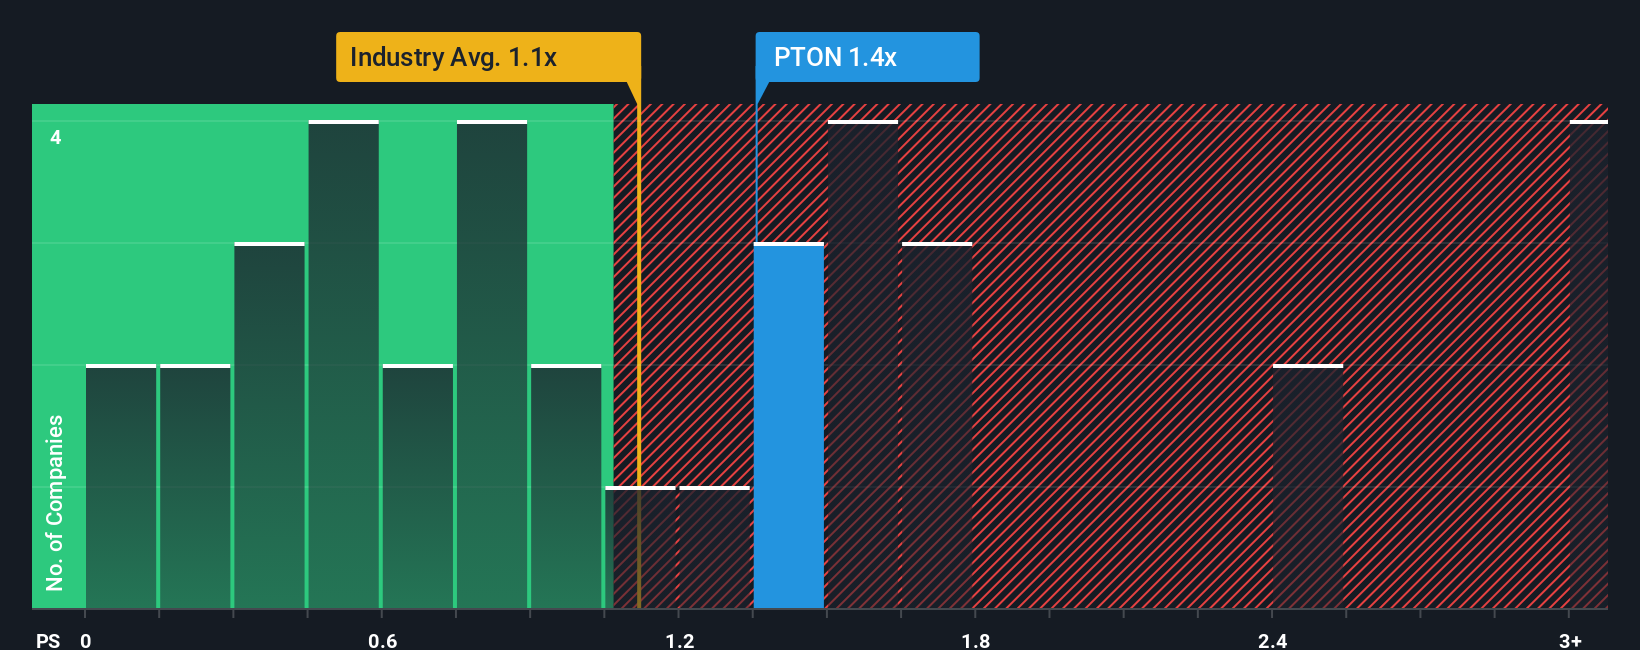
Approach 2: Peloton Interactive Price vs Sales
For companies like Peloton that are still working toward consistent profitability, the Price to Sales multiple is often a more useful yardstick than earnings based ratios, because it focuses on how the market values each dollar of revenue regardless of near term losses.
In general, faster revenue growth and lower perceived risk justify a higher P S ratio, while slower growth and higher uncertainty call for a lower multiple. Peloton currently trades on about 1.09x sales, a touch above both the Leisure industry average of roughly 0.93x and the peer group average of around 0.94x. This suggests the market is still assigning a modest premium to its turnaround story.
Simply Wall St's Fair Ratio framework estimates what a reasonable P S multiple should be once Peloton's growth prospects, margin profile, competitive position, size and risk are factored in, arriving at a Fair Ratio of about 1.04x. This is more tailored than a simple comparison with peers or the sector because it adjusts for company specific drivers rather than assuming all firms deserve similar pricing. With Peloton's actual P S of 1.09x sitting only slightly above the 1.04x Fair Ratio, the shares appear broadly in line with fundamentals rather than clearly cheap or expensive.
Result: ABOUT RIGHT
PS ratios tell one story, but what if the real opportunity lies elsewhere? Discover 1442 companies where insiders are betting big on explosive growth.
Upgrade Your Decision Making: Choose your Peloton Interactive Narrative
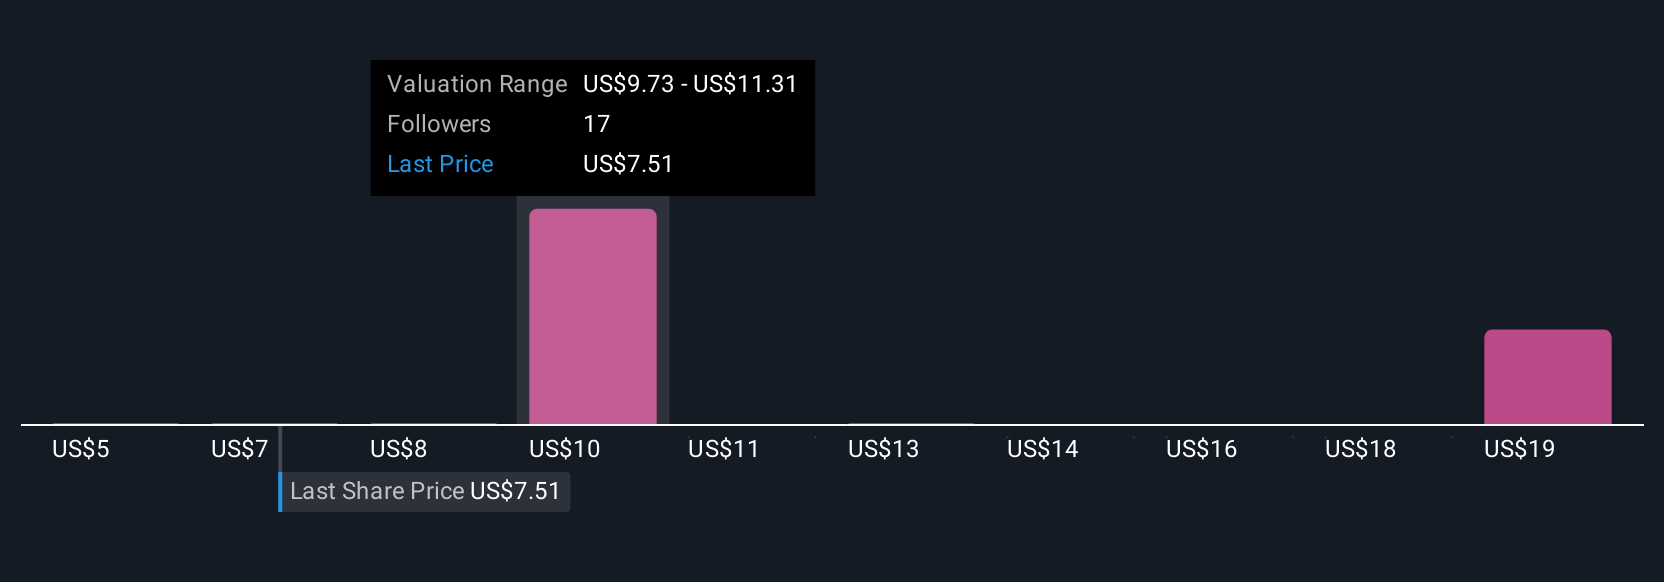
Earlier we mentioned that there is an even better way to understand valuation, so let us introduce you to Narratives, which are simple stories you build around a company that connect your view of its future revenue, earnings and margins to a financial forecast and ultimately to a fair value estimate. On Simply Wall St’s Community page, millions of investors use Narratives as an easy, accessible tool to spell out why they think a business like Peloton Interactive will grow or struggle, translate that story into projected financials, and then compare the resulting Fair Value to today’s share price to decide whether it looks like a buy, hold or sell. Because Narratives update dynamically when new information comes in, your Peloton view can shift as fresh earnings, news or product updates arrive, helping you avoid outdated assumptions. For example, one investor might see Peloton’s product overhaul, AI features and partnerships driving higher engagement and justify a fair value near the top of recent targets around $20 per share, while another focuses on subscriber risks and competition to argue for a far more cautious view closer to $5.
Do you think there's more to the story for Peloton Interactive? Head over to our Community to see what others are saying!
This article by Simply Wall St is general in nature. We provide commentary based on historical data and analyst forecasts only using an unbiased methodology and our articles are not intended to be financial advice. It does not constitute a recommendation to buy or sell any stock, and does not take account of your objectives, or your financial situation. We aim to bring you long-term focused analysis driven by fundamental data. Note that our analysis may not factor in the latest price-sensitive company announcements or qualitative material. Simply Wall St has no position in any stocks mentioned.
Have feedback on this article? Concerned about the content? Get in touch with us directly. Alternatively, email editorial-team@simplywallst.com