
- PREMIUM
- LIVE QUOTES
- INSTITUTION
 Index Options
 State Street
 CME Group
 Nasdaq
 Cboe
Cboe TradingView
 Wall Street Journal
Has Capital One’s Surging 2025 Share Price Already Reflected Its Changing Credit Landscape?
- Wondering if Capital One Financial is still a smart buy after its huge run, or if most of the upside is already baked into the price? This article will walk through what the current valuation is really telling us.
- The stock closed at $230.68 recently and has climbed 5.3% over the last week, 4.2% over the last month, and a strong 29.1% year to date, building on impressive 24.3% 1 year, 157.4% 3 year, and 173.8% 5 year returns that have caught a lot of investor attention.
- Recent headlines have focused on how Capital One is navigating a still shifting credit landscape and regulatory environment, along with ongoing scrutiny of its digital banking and card businesses. These developments help explain why the market has been steadily repricing the stock as investors reassess both growth potential and risk.
- On our framework, Capital One Financial currently scores just 2 out of 6 on undervaluation checks, which suggests the picture is more nuanced than the share price alone implies. Next, we will break down what different valuation approaches say about COF today and why there might be an even better way to think about its true worth by the end of this article.
Capital One Financial scores just 2/6 on our valuation checks. See what other red flags we found in the full valuation breakdown.
Approach 1: Capital One Financial Excess Returns Analysis
The Excess Returns model looks at how much profit Capital One can generate above the required return that shareholders demand, based on the company’s equity and its ability to earn attractive returns on that equity over time.
For Capital One, the starting point is a Book Value of $170.52 per share and a Stable EPS of $22.15 per share, derived from weighted future return on equity estimates from 9 analysts. With an Average Return on Equity of 12.03% and a Stable Book Value expected to reach $184.10 per share, the model suggests the business can keep compounding value rather than just treading water.
The required Cost of Equity is estimated at $16.07 per share, while the company is expected to produce an Excess Return of $6.08 per share above that hurdle. This is what ultimately drives intrinsic value higher in this framework.
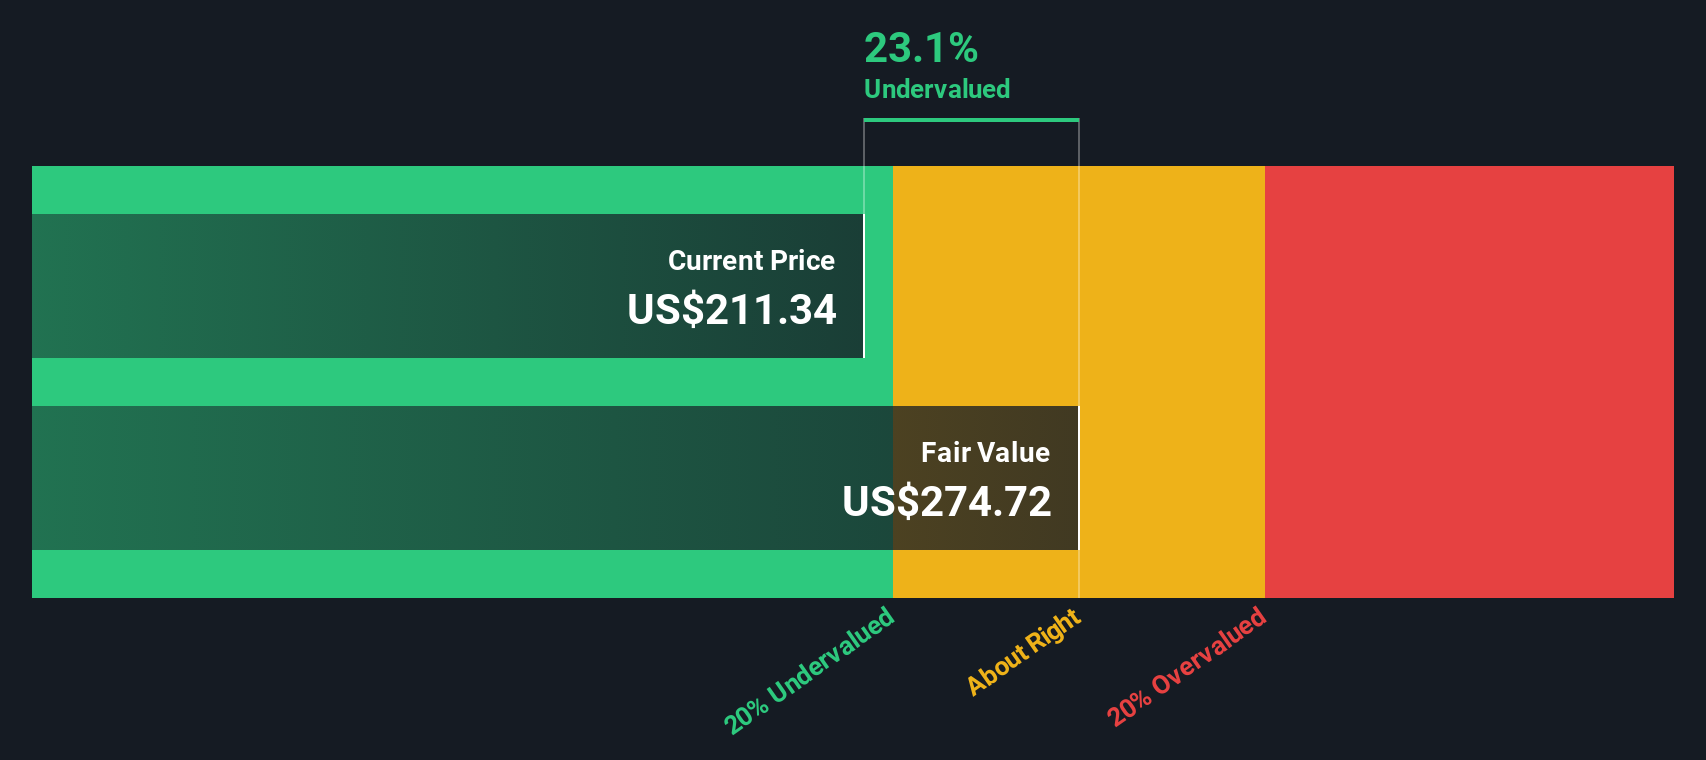
Putting these inputs together, the Excess Returns valuation arrives at an intrinsic value of about $295.21 per share, implying the stock is roughly 21.9% undervalued relative to the recent $230.68 share price.
Result: UNDERVALUED
Our Excess Returns analysis suggests Capital One Financial is undervalued by 21.9%. Track this in your watchlist or portfolio, or discover 906 more undervalued stocks based on cash flows.
Approach 2: Capital One Financial Price vs Earnings
For profitable companies like Capital One Financial, the price to earnings, or PE, ratio is a useful way to gauge how much investors are paying for each dollar of current earnings. Higher growth and lower perceived risk usually justify a higher PE multiple, while slower growth or greater uncertainty tend to compress what the market sees as a normal or fair PE.
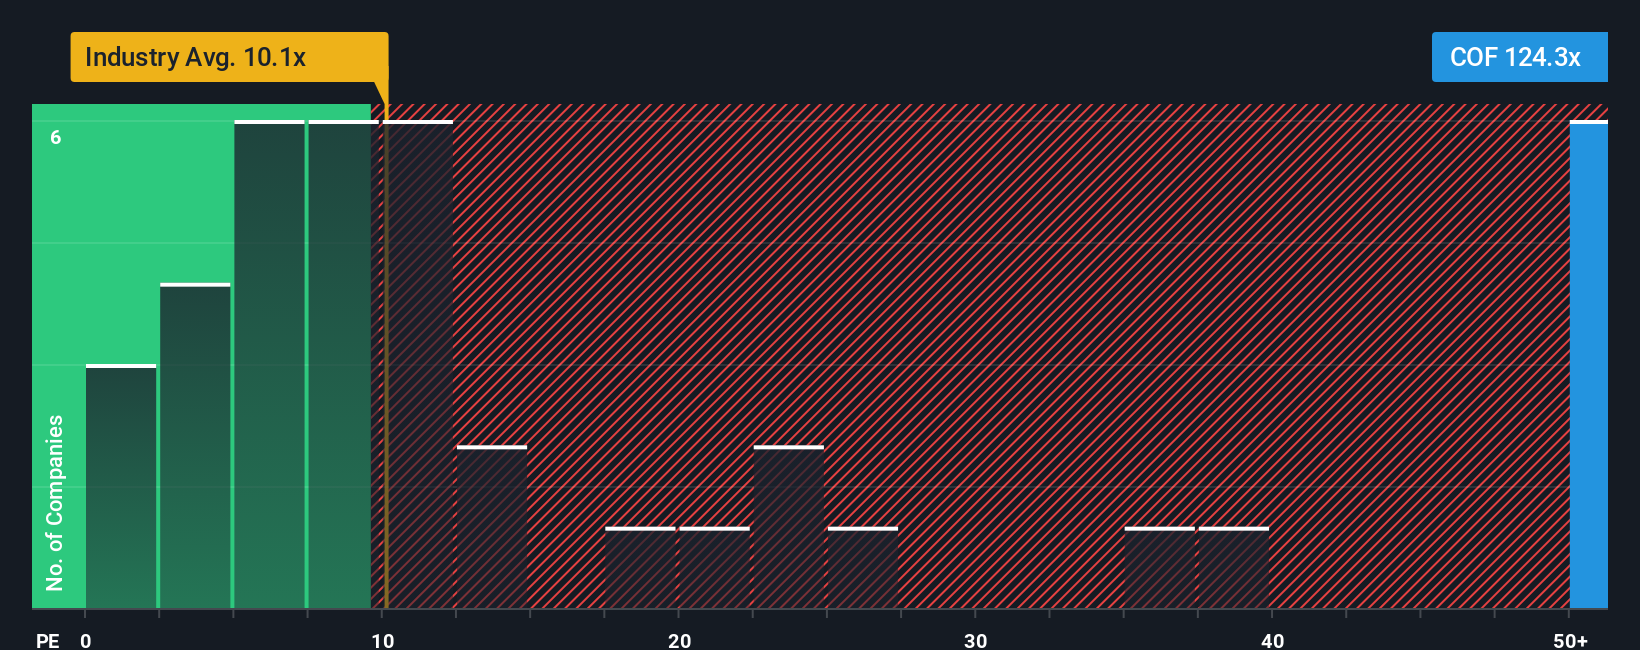
Capital One currently trades on a PE of 127.41x, which is far above both the Consumer Finance industry average of 10.26x and the broader peer group average of 27.51x. Those simple comparisons alone might suggest the stock is very expensive, but they do not fully account for company specific drivers such as earnings growth outlook, profitability, or its particular risk profile.
This is where Simply Wall St’s Fair Ratio comes in. For Capital One, the Fair PE Ratio is estimated at 30.76x, based on factors like expected earnings growth, margins, size and risk characteristics. Because this framework is tailored to the company rather than a rough peer or industry average, it provides a more nuanced anchor for valuation. With the actual 127.41x multiple sitting well above the 30.76x Fair Ratio, the stock screens as materially overvalued on this metric.
Result: OVERVALUED
PE ratios tell one story, but what if the real opportunity lies elsewhere? Discover 1442 companies where insiders are betting big on explosive growth.
Upgrade Your Decision Making: Choose your Capital One Financial Narrative
Earlier we mentioned that there is an even better way to understand valuation. Let us introduce you to Narratives, an easy tool on Simply Wall St’s Community page that lets you attach a clear story to your numbers. It links what you believe about a company’s future (its revenue, earnings, and margins) to a financial forecast and then to a Fair Value. This Fair Value updates dynamically as news or earnings arrive and can help you think about decisions by comparing that Fair Value with today’s Price. For Capital One Financial, one investor might build a bullish narrative around strong Discover integration, 30 percent plus revenue growth and a Fair Value near $260 per share. A more cautious investor could assume lower growth, margin pressure and a Fair Value closer to $160, both using the same framework but different stories to guide their decisions.
Do you think there's more to the story for Capital One Financial? Head over to our Community to see what others are saying!
This article by Simply Wall St is general in nature. We provide commentary based on historical data and analyst forecasts only using an unbiased methodology and our articles are not intended to be financial advice. It does not constitute a recommendation to buy or sell any stock, and does not take account of your objectives, or your financial situation. We aim to bring you long-term focused analysis driven by fundamental data. Note that our analysis may not factor in the latest price-sensitive company announcements or qualitative material. Simply Wall St has no position in any stocks mentioned.
Have feedback on this article? Concerned about the content? Get in touch with us directly. Alternatively, email editorial-team@simplywallst.com