
- PREMIUM
- LIVE QUOTES
- INSTITUTION
 Index Options
 State Street
 CME Group
 Nasdaq
 Cboe
Cboe TradingView
 Wall Street Journal
Is It Too Late to Consider Brighthouse Financial After Its Recent 26% Price Surge?
- If you are wondering whether Brighthouse Financial, at around $65 a share, still offers real value or if the easy money has already been made, you are in the right place.
- The stock has slipped about 0.3% over the last week, but that comes after a powerful 26.2% jump over the past month, 36.2% year to date and a 94.0% gain over five years, which tells us sentiment has shifted meaningfully.
- Recent headlines have focused on how life insurers like Brighthouse are repositioning their product mix and balance sheets as interest rates stabilize, with investors reassessing which names are best placed for a higher for longer rate backdrop. There has also been renewed attention on regulatory capital and risk based frameworks across the sector, which helps explain some of the volatility behind those sharp price moves.
- On our checks, Brighthouse Financial posts a valuation score of 4/6, suggesting it screens as undervalued on most but not all metrics. In the next sections we will dig into those different valuation approaches and explore an even more insightful way to think about what the market is really pricing in.
Approach 1: Brighthouse Financial Excess Returns Analysis
The Excess Returns model looks at how much profit a company can generate above the return that investors require on the equity they provide, then capitalizes those surplus returns into an intrinsic value per share.
For Brighthouse Financial, the model starts with a Book Value of $111.33 per share and a Stable EPS of $7.74 per share, based on the median return on equity from the past five years. The Average Return on Equity works out to 7.41%, while the implied Cost of Equity is higher at $10.32 per share. That gap produces an Excess Return of $-2.58 per share, meaning the company is not currently expected to earn more than its cost of capital on equity.
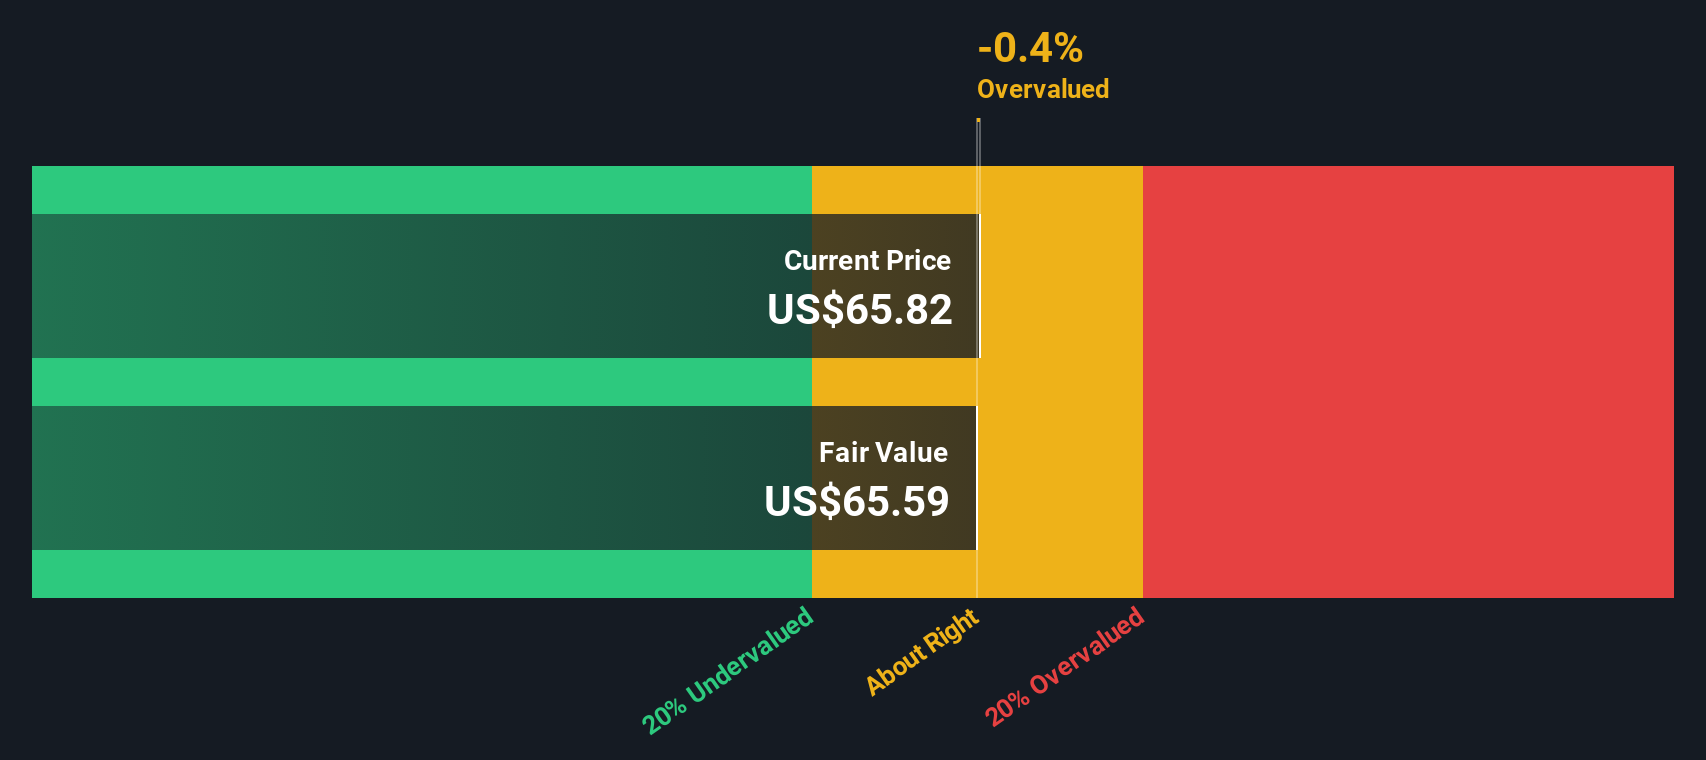
Analysts also project a Stable Book Value of $104.49 per share, drawn from weighted future book value estimates by four analysts. When these elements are combined in the Excess Returns framework, they imply an intrinsic value of about $65.53 per share, only 0.3% above the current price. This suggests the stock is trading very close to fair value on this metric.
Result: ABOUT RIGHT
Brighthouse Financial is fairly valued according to our Excess Returns, but this can change at a moment's notice. Track the value in your watchlist or portfolio and be alerted on when to act.
Approach 2: Brighthouse Financial Price vs Earnings
For a consistently profitable business like Brighthouse Financial, the price to earnings ratio is a helpful shorthand for how much investors are willing to pay for each dollar of current earnings. In general, faster growth and lower perceived risk justify a higher PE, while slower growth and greater uncertainty tend to anchor the multiple closer to, or below, the market and sector norms.
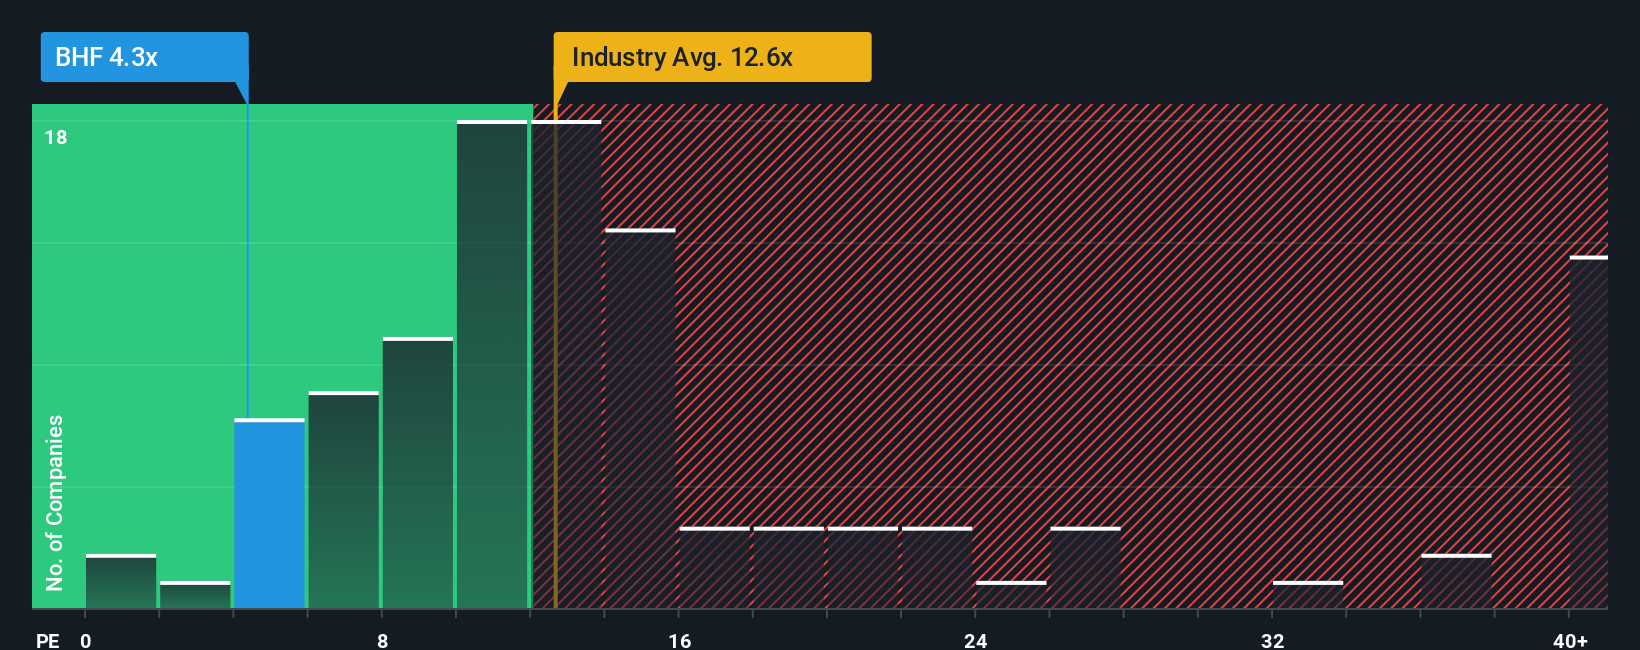
Brighthouse currently trades on a PE of about 4.3x, which is well below both the Insurance industry average of roughly 12.8x and a peer group average of about 10.2x. On the surface, that kind of discount suggests the market is pricing in weaker or more volatile earnings, or higher risk, than for many rival insurers.
Simply Wall St’s Fair Ratio framework goes a step further than simple peer or industry comparisons. It estimates what a “normal” PE should be for Brighthouse, given its earnings growth profile, profitability, risk factors, industry positioning and market cap, and arrives at a Fair Ratio of about 17.5x. Because this is materially above the current 4.3x, the model implies the shares are trading at a substantial discount to where they might sit if the company were valued purely on these fundamentals.
Result: UNDERVALUED
PE ratios tell one story, but what if the real opportunity lies elsewhere? Discover 1442 companies where insiders are betting big on explosive growth.
Upgrade Your Decision Making: Choose your Brighthouse Financial Narrative
Earlier we mentioned that there is an even better way to understand valuation. Let us introduce you to Narratives, a simple framework where you connect your view of Brighthouse Financial’s story to a concrete forecast for its future revenue, earnings and margins, and then translate that into a personal fair value that you can compare directly with today’s share price.
On Simply Wall St’s Community page, Narratives let millions of investors express how they think catalysts like strong annuity demand, technology investments or acquisition uncertainty will shape Brighthouse’s numbers. The platform automatically turns those assumptions into a dynamic fair value that updates as fresh news, results or analyst revisions come in.
For example, one Brighthouse Narrative might assume earnings rise toward the more bullish $1.3 billion outcome and justify a fair value close to the upper $72 price target. A more cautious investor might anchor on the $774 million earnings case, a lower PE and a fair value nearer $42. By comparing each Narrative’s fair value to the current price, both investors get a clear, easy signal about whether they believe Brighthouse is a buy, hold or sell today.
Do you think there's more to the story for Brighthouse Financial? Head over to our Community to see what others are saying!
This article by Simply Wall St is general in nature. We provide commentary based on historical data and analyst forecasts only using an unbiased methodology and our articles are not intended to be financial advice. It does not constitute a recommendation to buy or sell any stock, and does not take account of your objectives, or your financial situation. We aim to bring you long-term focused analysis driven by fundamental data. Note that our analysis may not factor in the latest price-sensitive company announcements or qualitative material. Simply Wall St has no position in any stocks mentioned.
Have feedback on this article? Concerned about the content? Get in touch with us directly. Alternatively, email editorial-team@simplywallst.com