
- PREMIUM
- LIVE QUOTES
- INSTITUTION
 Index Options
 State Street
 CME Group
 Nasdaq
 Cboe
Cboe TradingView
 Wall Street Journal
Is It Too Late to Consider Prologis After Its Strong 2025 Share Price Run?
- If you are wondering whether Prologis at around $127.98 is still a smart way to play the logistics real estate boom, or if most of the upside is already priced in, you are in the right place.
- Despite a modest dip of around 0.4% over the last week, the stock is up 3.4% over 30 days, 22.8% year to date, and 18.4% over the past year, with a 50.9% gain over five years that signals long term strength.
- Recent sentiment has been shaped by ongoing demand for modern logistics facilities, as e commerce, reshoring, and supply chain restructuring keep high quality industrial space in short supply. At the same time, shifting expectations for interest rates and cap rates across commercial real estate have made investors more selective about which REITs can genuinely justify premium valuations.
- For all that momentum, Prologis currently scores 0/6 on our valuation checks. Over the next sections we will unpack what that means using multiple valuation approaches, before finishing with an even more intuitive way to think about what this stock is really worth.
Prologis scores just 0/6 on our valuation checks. See what other red flags we found in the full valuation breakdown.
Approach 1: Prologis Discounted Cash Flow (DCF) Analysis
A Discounted Cash Flow model projects Prologis adjusted funds from operations into the future, then discounts those cash flows back to today in $ terms to estimate what the business is worth now.
Prologis last reported around $5.8 billion in free cash flow, and analysts expect this to trend modestly lower in the near term before reaccelerating, with Simply Wall St extrapolations pointing to about $8.1 billion of free cash flow by 2035. These projections combine analyst estimates for the next few years with longer term growth assumptions for the decade ahead.
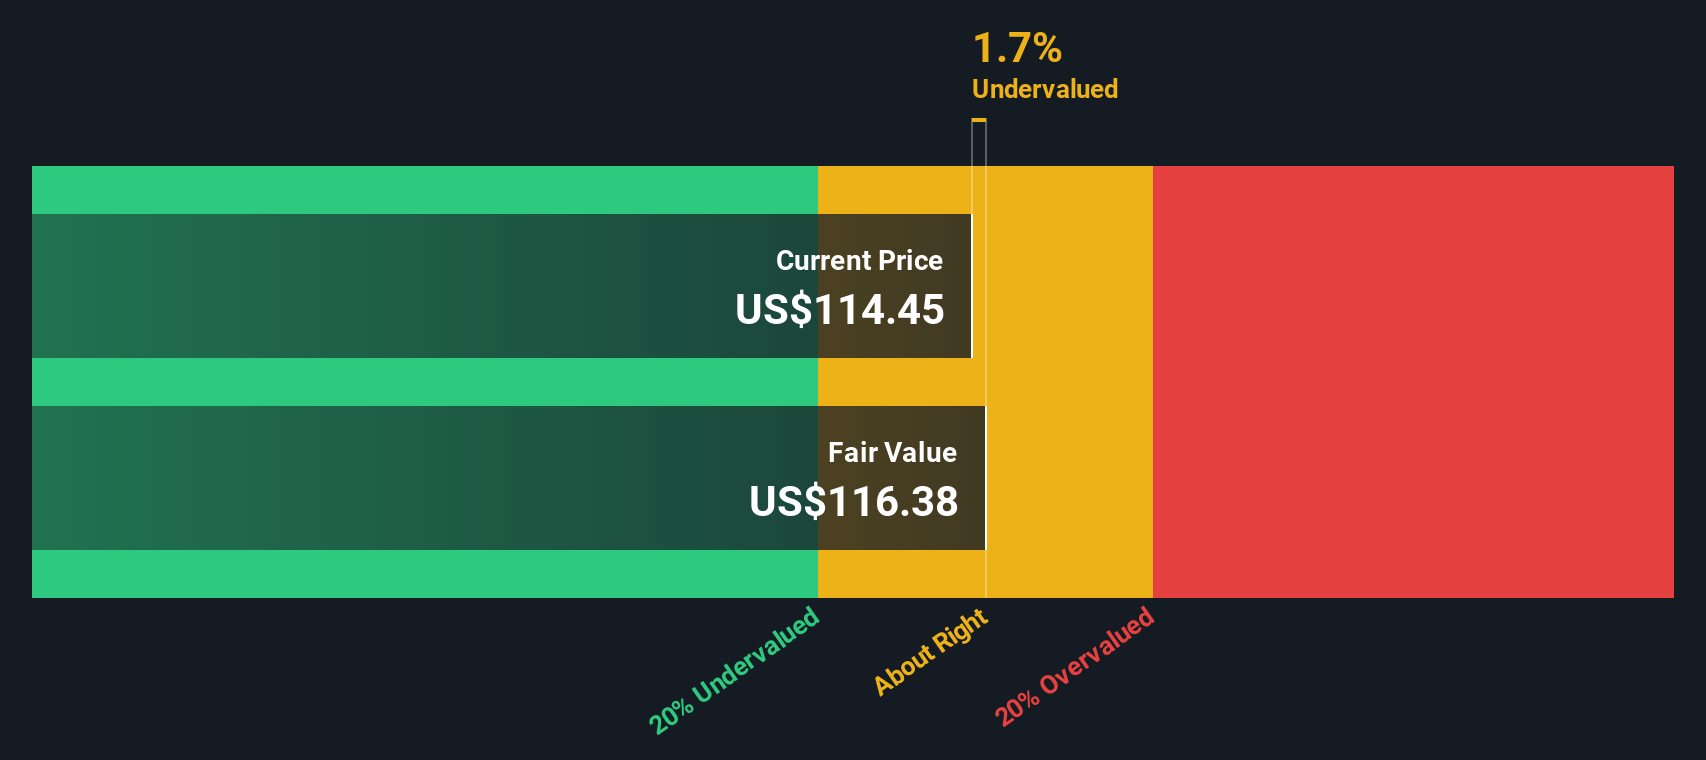
When all future cash flows are discounted back to today using this 2 stage Free Cash Flow to Equity model, the intrinsic value is estimated at roughly $110.35 per share. Compared with a current share price around $128, the DCF output indicates the stock is about 16.0% overvalued.
Result: OVERVALUED
Our Discounted Cash Flow (DCF) analysis suggests Prologis may be overvalued by 16.0%. Discover 906 undervalued stocks or create your own screener to find better value opportunities.
Approach 2: Prologis Price vs Earnings
For consistently profitable companies like Prologis, the price to earnings ratio is a useful shorthand for how much investors are willing to pay for each dollar of current earnings. It captures both what the business is earning today and what the market expects those earnings to do over time.
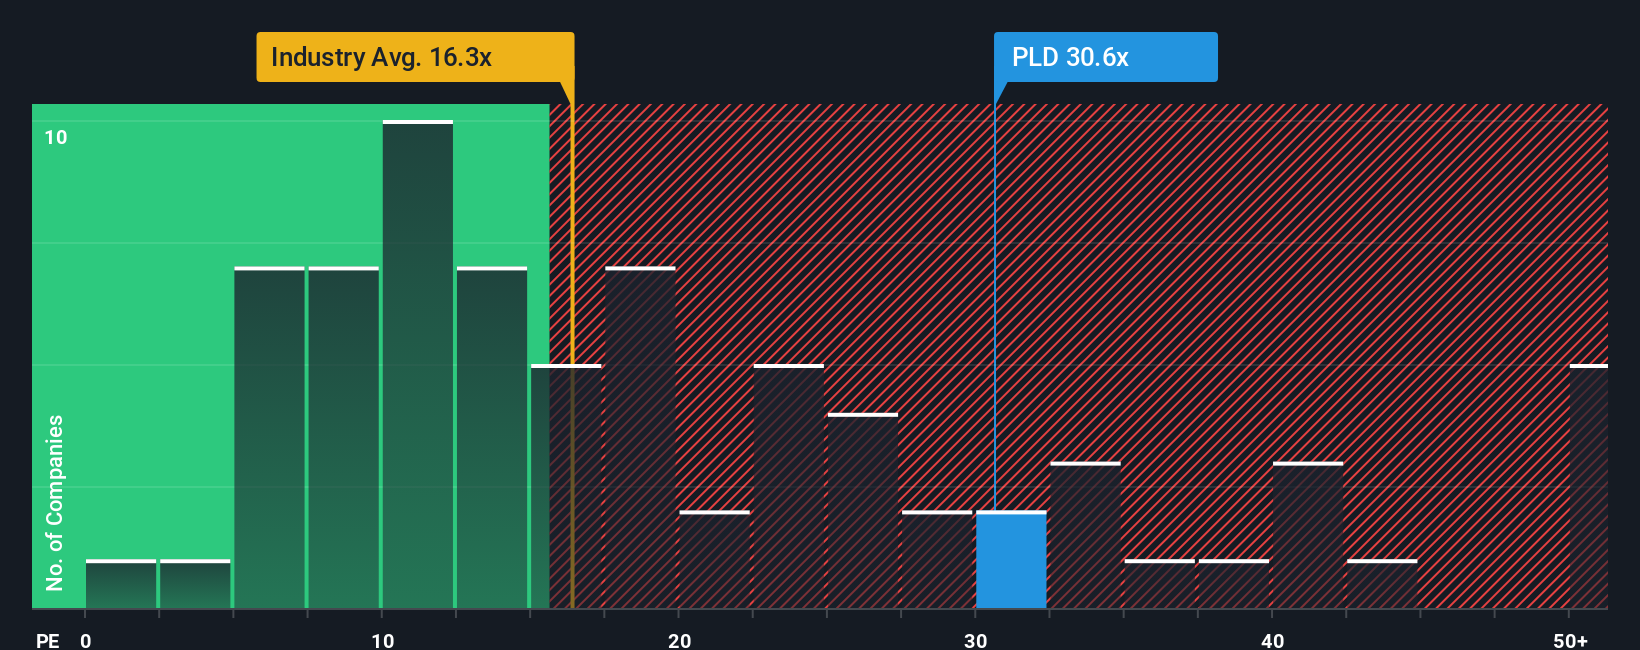
In practice, a higher PE ratio is usually justified when investors see stronger, more reliable growth with lower risk, while slower or more uncertain growth should command a lower, more conservative multiple. Prologis currently trades on about 37.1x earnings, which is well above the Industrial REITs average of roughly 15.9x and also ahead of the 32.5x average for its closer peer group.
Simply Wall St uses a “Fair Ratio” to refine this comparison. This proprietary PE estimate, about 32.5x for Prologis, reflects factors like its earnings growth prospects, industry, profit margins, market cap, and key risks. Because it is tailored to the company rather than just broad group averages, it offers a more nuanced benchmark than simple peer or sector comparisons. With the current PE of 37.1x sitting meaningfully above the Fair Ratio, Prologis screens as somewhat expensive on this metric.
Result: OVERVALUED
PE ratios tell one story, but what if the real opportunity lies elsewhere? Discover 1442 companies where insiders are betting big on explosive growth.
Upgrade Your Decision Making: Choose your Prologis Narrative
Earlier we mentioned that there is an even better way to understand valuation, so let us introduce you to Narratives, a simple framework where you describe your story about a company, connect it to a set of financial assumptions like future revenue, earnings and margins, and then see the fair value that drops out of that story.
On Simply Wall St, Narratives sit inside the Community page and act as an accessible bridge between the qualitative and the quantitative. They link a company’s real world drivers to a forward looking forecast, and then to a clear, comparable fair value that you can weigh against today’s share price to decide whether to buy, hold, or sell.
These Narratives update dynamically as new data, news, and earnings land in the platform. This means your view of Prologis is grounded in the latest information rather than a static spreadsheet.
For example, one Prologis Narrative might assume that robust leasing, limited new supply, and expanding value added services justify a fair value closer to $140. A more cautious Narrative that focuses on higher vacancies, slower leasing, and macro risks could support a fair value nearer $95. The power of the tool lies in choosing which story you believe is more probable and adjusting your decisions accordingly.
Do you think there's more to the story for Prologis? Head over to our Community to see what others are saying!
This article by Simply Wall St is general in nature. We provide commentary based on historical data and analyst forecasts only using an unbiased methodology and our articles are not intended to be financial advice. It does not constitute a recommendation to buy or sell any stock, and does not take account of your objectives, or your financial situation. We aim to bring you long-term focused analysis driven by fundamental data. Note that our analysis may not factor in the latest price-sensitive company announcements or qualitative material. Simply Wall St has no position in any stocks mentioned.
Have feedback on this article? Concerned about the content? Get in touch with us directly. Alternatively, email editorial-team@simplywallst.com