
- PREMIUM
- LIVE QUOTES
- INSTITUTION
 Index Options
 State Street
 CME Group
 Nasdaq
 Cboe
Cboe TradingView
 Wall Street Journal
Should Investors Chase Constellation Energy After Its 311% Three Year Surge?
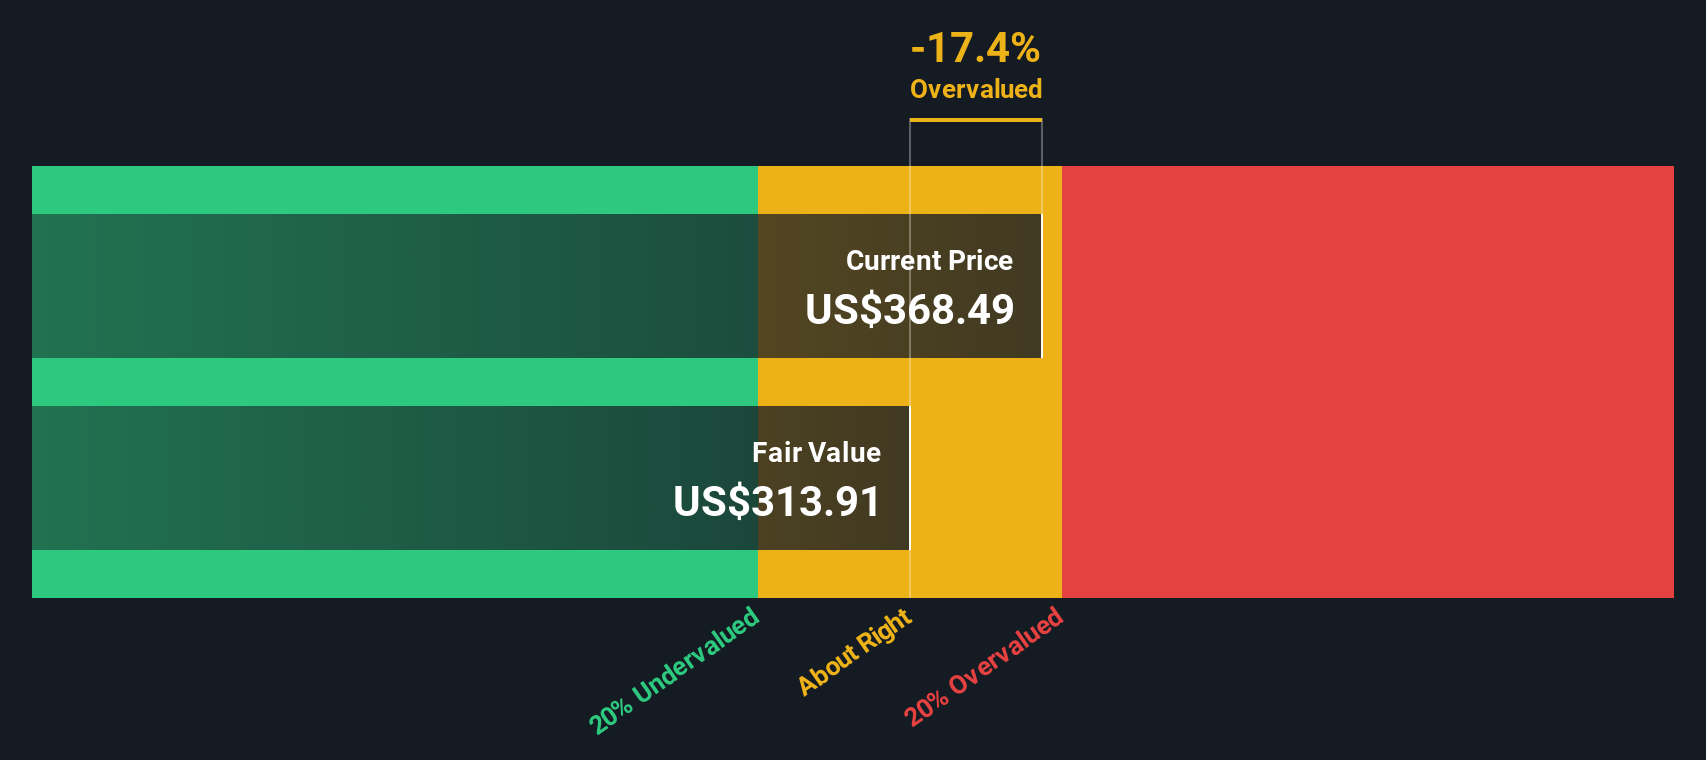
- If you are wondering whether Constellation Energy at around $359 a share is still worth chasing after a huge multi year run, you are not alone. This is exactly the question we will unpack.
- The stock has dipped slightly in the last week and month, down about 1.2% over 7 days and 0.9% over 30 days, but it is still up 48.3% year to date and 42.7% over the last year, with a 311.0% gain over 3 years.
- Those kinds of returns have been associated with rising optimism around US power markets and the value of reliable, low carbon baseload generation capacity, with investors increasingly paying up for companies positioned to benefit from data center and electrification demand. At the same time, policy momentum around decarbonization and nuclear support has reinforced the idea that Constellation’s asset base could command a structural premium. That helps explain why the stock has stayed strong even during recent pullbacks.
- Despite that enthusiasm, Constellation Energy only scores a 2 out of 6 on our valuation checks, which suggests that by some traditional measures it is not obviously cheap. Next we will break down what different valuation methods are really saying about the stock and finish by looking at one approach that can tie all of those signals together more intuitively.
Constellation Energy scores just 2/6 on our valuation checks. See what other red flags we found in the full valuation breakdown.
Approach 1: Constellation Energy Discounted Cash Flow (DCF) Analysis
A Discounted Cash Flow model estimates what a company is worth today by projecting its future cash flows and discounting them back into present value using a required rate of return.
For Constellation Energy, the latest twelve months Free Cash Flow is negative at about $657 Million, reflecting heavy investment and volatility in near term cash generation. Analysts and model extensions, however, expect this to swing sharply higher, with projected Free Cash Flow reaching roughly $5.7 Billion by 2029 and continuing to grow toward around $7.9 Billion by 2035, based on a two stage Free Cash Flow to Equity framework that blends analyst forecasts with Simply Wall St extrapolations.
When these projected cash flows are discounted back, the model arrives at an intrinsic value of roughly $492 per share in $. Compared with the current share price near $359, the DCF implies the stock is about 26.9% undervalued, indicating that the market may not be fully pricing in the long term cash flow recovery and growth expectations embedded in the model.
Result: UNDERVALUED
Our Discounted Cash Flow (DCF) analysis suggests Constellation Energy is undervalued by 26.9%. Track this in your watchlist or portfolio, or discover 906 more undervalued stocks based on cash flows.
Approach 2: Constellation Energy Price vs Earnings
For profitable businesses, the Price to Earnings ratio is often the most intuitive way to think about valuation because it links the share price directly to the profits each share is entitled to. In general, companies with faster, more reliable earnings growth and lower risk tend to justify a higher PE multiple, while slower growing or riskier companies usually deserve a lower one.
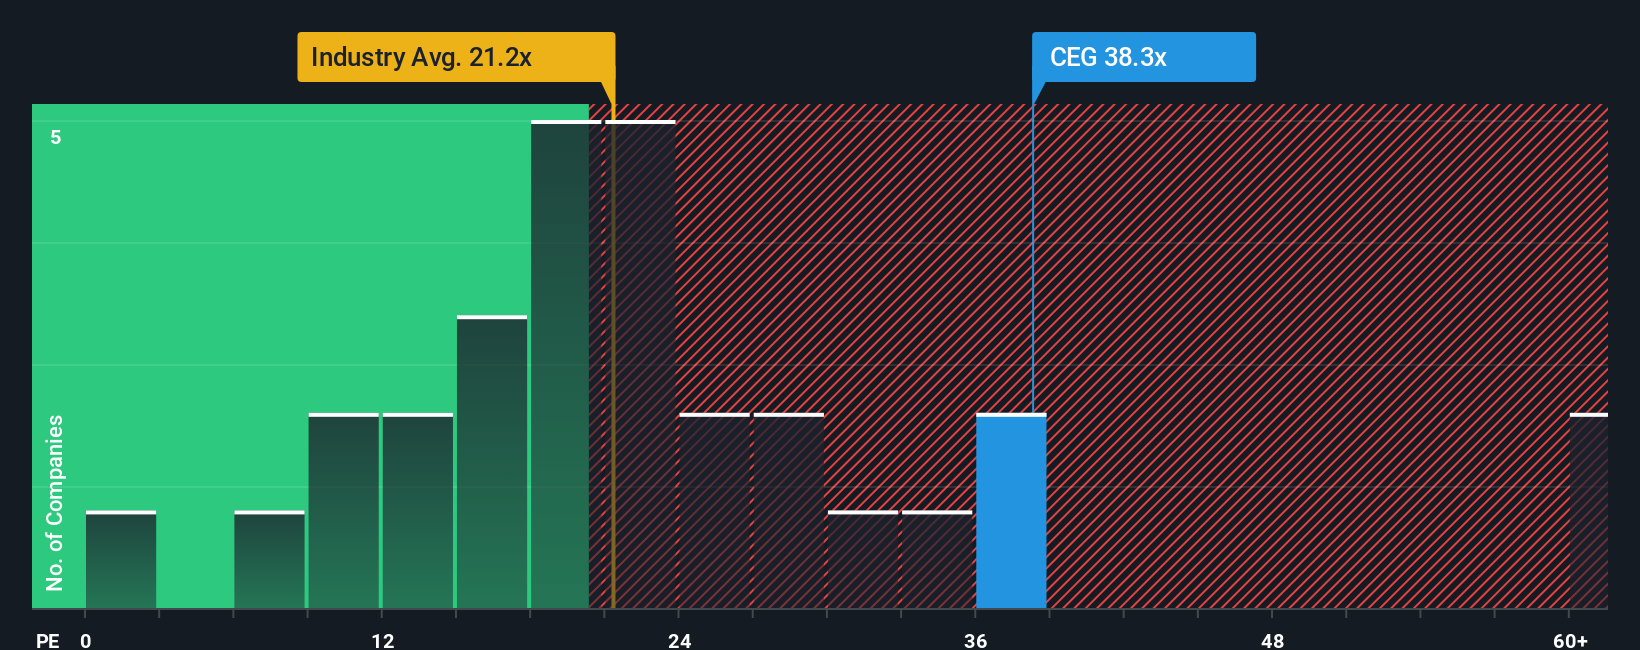
Constellation Energy currently trades on about 41.0x earnings, which is roughly double the Electric Utilities industry average of around 19.9x and also above the broader peer average of about 20.9x. At first glance that makes the stock look expensive. However, Simply Wall St uses a proprietary “Fair Ratio” to estimate what PE a company should command once you factor in its earnings growth outlook, industry, profit margins, market cap and specific risks. For Constellation, this Fair Ratio is about 38.1x, only modestly below the current market multiple.
Because the actual PE is slightly above, but still close to, the Fair Ratio, the multiple suggests Constellation is somewhat richly valued but not wildly out of line with its fundamentals.
Result: OVERVALUED
PE ratios tell one story, but what if the real opportunity lies elsewhere? Discover 1442 companies where insiders are betting big on explosive growth.
Upgrade Your Decision Making: Choose your Constellation Energy Narrative
Earlier we mentioned that there is an even better way to understand valuation, so let us introduce you to Narratives, a simple framework on Simply Wall St’s Community page that lets you write the story behind your numbers by connecting your assumptions about future revenue, earnings and margins to a financial forecast and, ultimately, a fair value you can compare against today’s share price to inform your decision.
Instead of only looking at static metrics like PE or DCF, a Narrative makes you spell out why you think Constellation’s nuclear assets, data center contracts or policy tailwinds will play out a certain way. It then automatically turns that story into projected financials and a fair value estimate that updates dynamically when new earnings, news or guidance arrives.
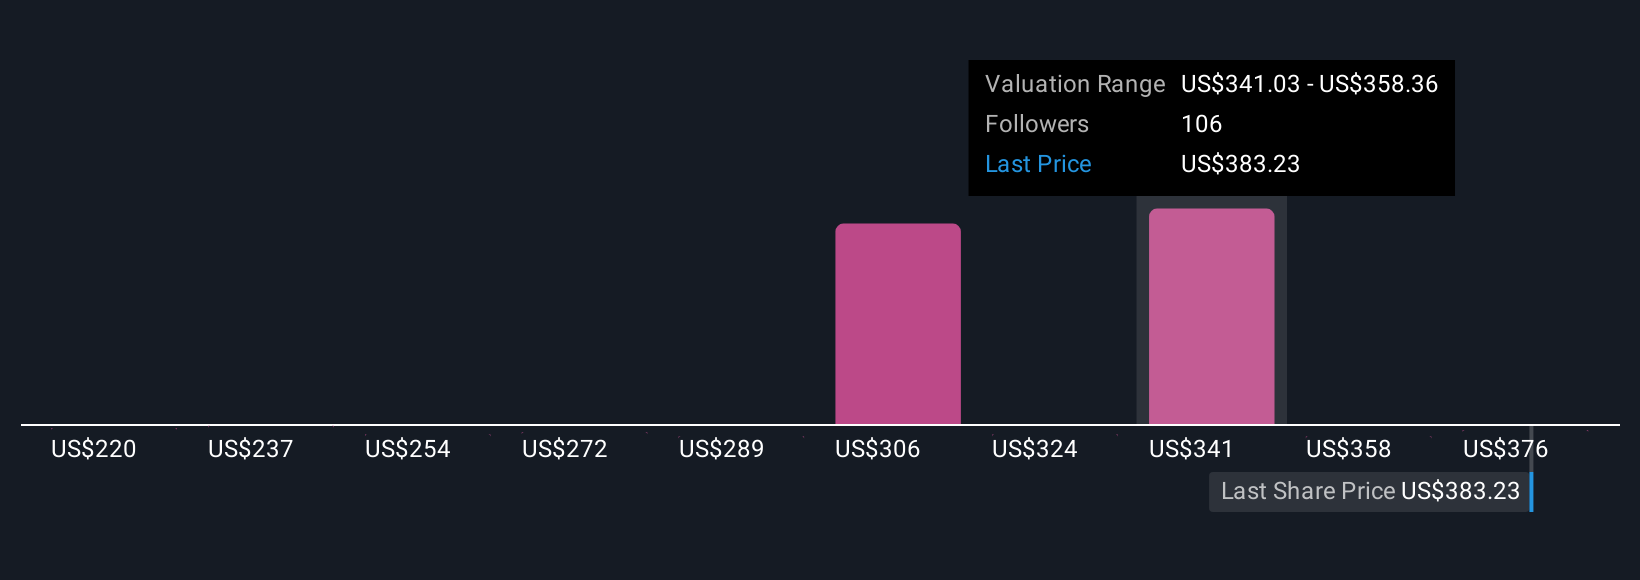
On Constellation Energy, for example, one investor’s Narrative might lean into expectations of strong demand for carbon free baseload power and the Calpine merger to justify a fair value closer to the upper end of recent targets. Another might focus on regulatory and concentration risks to anchor near the low end, and both perspectives can coexist transparently on the platform so you can see how your view compares.
Do you think there's more to the story for Constellation Energy? Head over to our Community to see what others are saying!
This article by Simply Wall St is general in nature. We provide commentary based on historical data and analyst forecasts only using an unbiased methodology and our articles are not intended to be financial advice. It does not constitute a recommendation to buy or sell any stock, and does not take account of your objectives, or your financial situation. We aim to bring you long-term focused analysis driven by fundamental data. Note that our analysis may not factor in the latest price-sensitive company announcements or qualitative material. Simply Wall St has no position in any stocks mentioned.
Have feedback on this article? Concerned about the content? Get in touch with us directly. Alternatively, email editorial-team@simplywallst.com