
- PREMIUM
- LIVE QUOTES
- INSTITUTION
 Index Options
 State Street
 CME Group
 Nasdaq
 Cboe
Cboe TradingView
 Wall Street Journal
Has Raiffeisen’s Rapid 2024 Share Price Surge Gone Too Far?
- Wondering if Raiffeisen Bank International is still good value after its big run, or if you have missed the boat? This breakdown will walk you through what the current price is really baking in.
- The stock is now trading around €34.82. While it has dipped slightly over the last week, it is still up 12.0% over 30 days, 82.2% year to date, and 86.0% over the past year, with a 183.3% gain over three years and 165.5% over five years.
- Those gains have come against a backdrop of shifting expectations for European banks, evolving geopolitical risks tied to the bank's Central and Eastern European exposure, and ongoing regulatory scrutiny of cross border operations. Investors have been repricing Raiffeisen as sentiment improves around regional growth, capital strength, and the sector's resilience to macro shocks.
- On our framework, Raiffeisen scores a modest 2 out of 6 on undervaluation checks. We will dig into how different valuation methods interpret that score, and then finish by looking at a more holistic way to think about what the stock is really worth.
Raiffeisen Bank International scores just 2/6 on our valuation checks. See what other red flags we found in the full valuation breakdown.
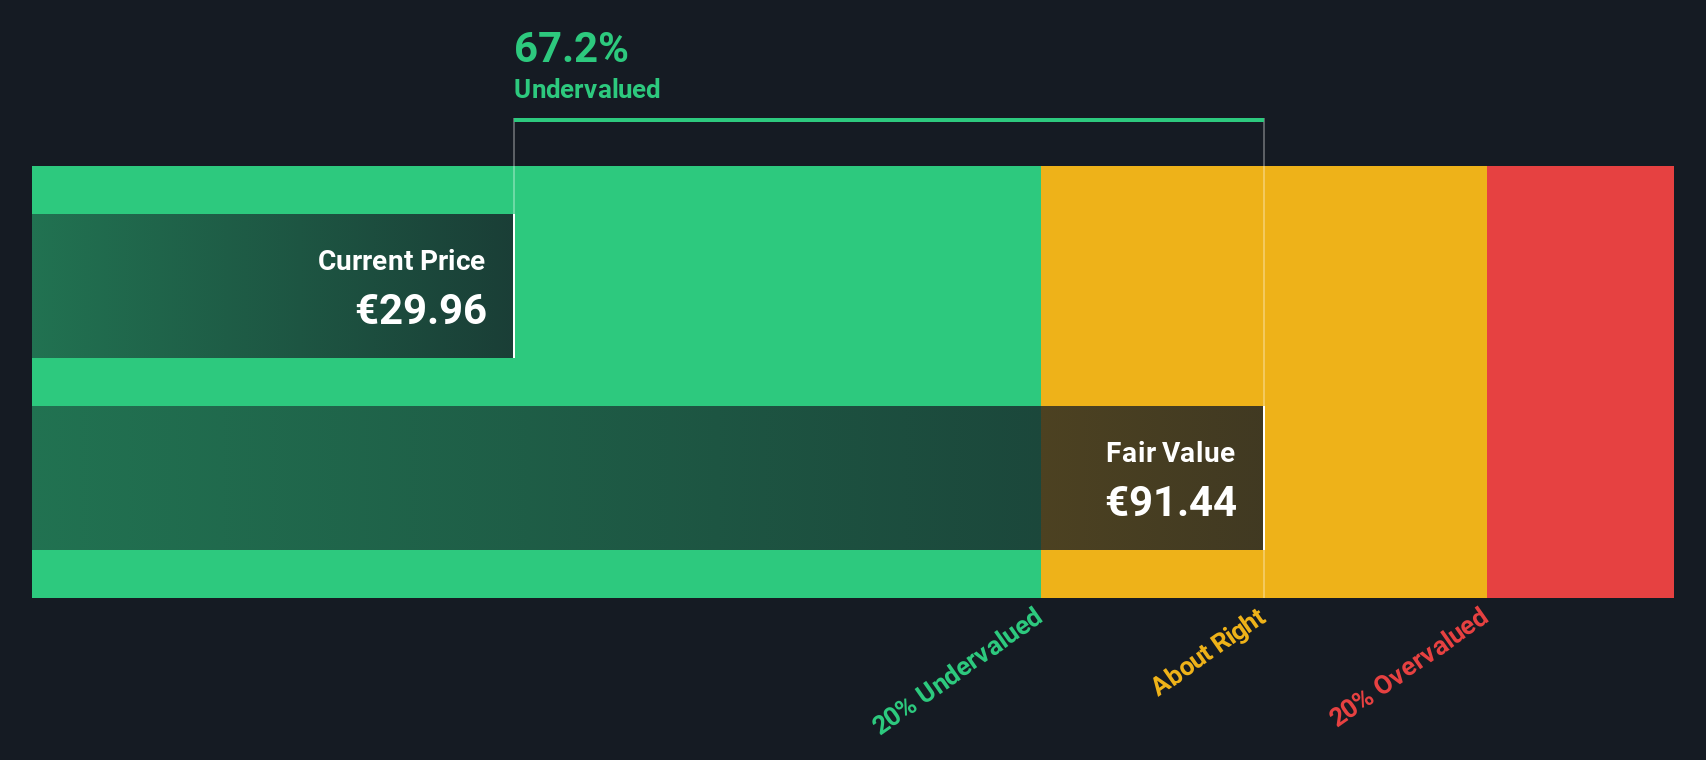
Approach 1: Raiffeisen Bank International Excess Returns Analysis
The Excess Returns model looks at how much profit a bank can earn above the minimum return that shareholders demand, and then projects how long those extra profits can be sustained. Instead of focusing on cash flows, it starts from the equity on the balance sheet and the return on that equity over time.
For Raiffeisen Bank International, the model assumes a Book Value of €57.36 per share and a Stable EPS of €5.41 per share, based on weighted future Return on Equity estimates from 8 analysts. With an Average Return on Equity of 8.86% and a Cost of Equity of €4.24 per share, the bank is expected to generate Excess Return of €1.17 per share on a Stable Book Value of €61.10 per share, which in turn is based on future book value estimates from 4 analysts.
Using these inputs, the Excess Returns valuation suggests an intrinsic value of about €84.78 per share, implying the stock is roughly 58.9% undervalued versus the current price near €34.82.
Result: UNDERVALUED
Our Excess Returns analysis suggests Raiffeisen Bank International is undervalued by 58.9%. Track this in your watchlist or portfolio, or discover 906 more undervalued stocks based on cash flows.
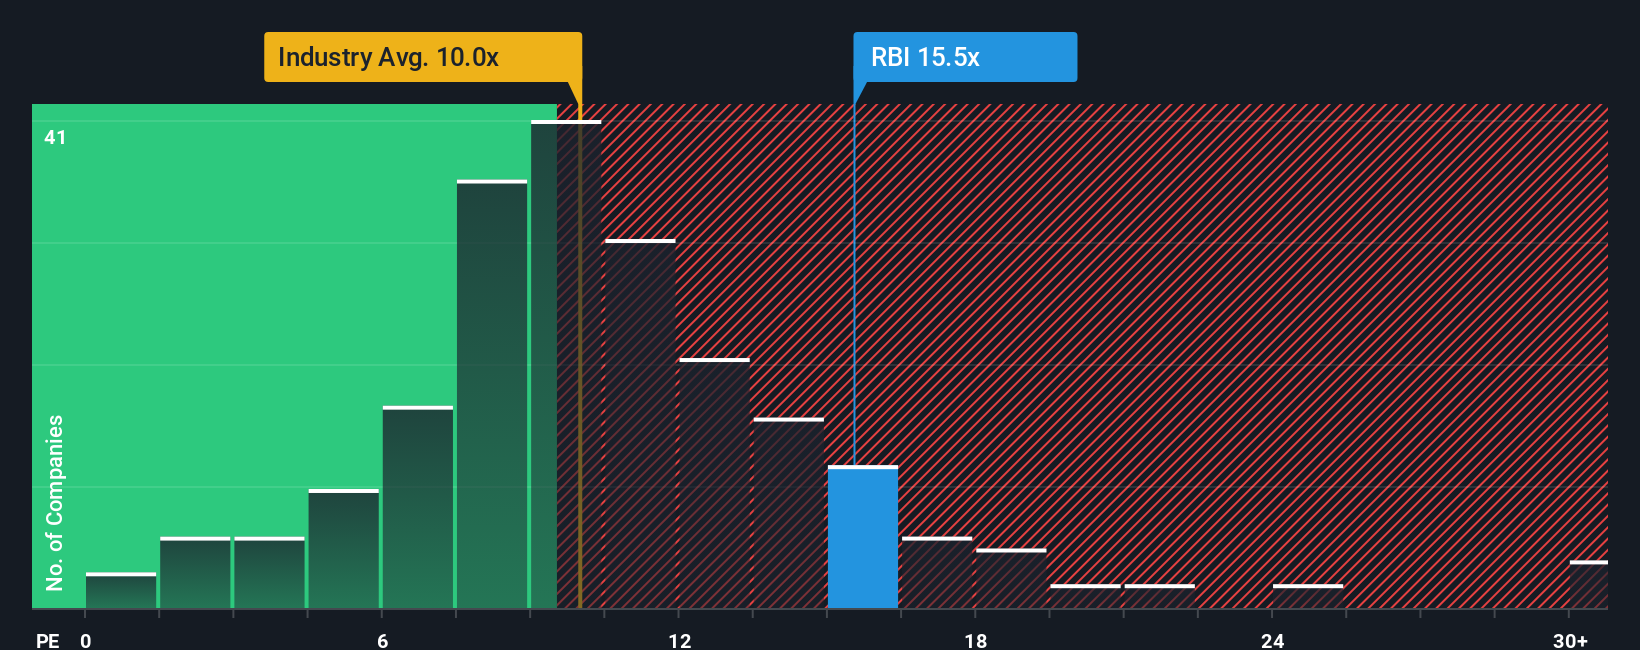
Approach 2: Raiffeisen Bank International Price vs Earnings
For a profitable bank like Raiffeisen Bank International, the price to earnings ratio is a practical way to judge value because it ties the share price directly to the profits each share is generating today. Investors typically pay a higher PE for companies with stronger growth prospects and lower perceived risk, while slower growing or riskier firms usually trade on lower multiples.
Raiffeisen currently trades on about 16.67x earnings, which is above both the wider Banks industry average of roughly 10.58x and the peer group average of around 13.31x. Simply Wall St also calculates a Fair Ratio of 13.86x, which represents the PE you might expect given Raiffeisen’s earnings growth outlook, profitability, size and risk profile. This Fair Ratio is more tailored than a simple comparison with peers or the sector, because it adjusts for Raiffeisen’s specific growth drivers, geographic and regulatory risks, and capital position.
On this basis, Raiffeisen’s actual PE of 16.67x sits notably above the Fair Ratio of 13.86x. This suggests the market is pricing in a premium that looks stretched relative to its fundamentals.
Result: OVERVALUED
PE ratios tell one story, but what if the real opportunity lies elsewhere? Discover 1442 companies where insiders are betting big on explosive growth.
Upgrade Your Decision Making: Choose your Raiffeisen Bank International Narrative
Earlier we mentioned that there is an even better way to understand valuation, so let us introduce you to Narratives, a simple way to connect your view of Raiffeisen Bank International’s story with a concrete financial forecast and a fair value estimate.
A Narrative on Simply Wall St is your story behind the numbers, where you spell out how you expect revenue, earnings and margins to evolve, link that to a fair value per share, and then compare that fair value to the current price to decide whether Raiffeisen looks like a buy, hold or sell.
These Narratives live on the Community page of Simply Wall St, are easy to create and use, and automatically update as new information such as earnings releases, news or regulatory developments is incorporated into the underlying data.
For example, one Raiffeisen Narrative might lean bullish, highlighting digital growth and capital strength to support a higher fair value than the recent price near €34.82. Another might focus on geopolitical and litigation risks to justify a fair value closer to the lower analyst targets. By comparing these perspectives, you can quickly see which story and valuation assumptions you find more believable.
Do you think there's more to the story for Raiffeisen Bank International? Head over to our Community to see what others are saying!

This article by Simply Wall St is general in nature. We provide commentary based on historical data and analyst forecasts only using an unbiased methodology and our articles are not intended to be financial advice. It does not constitute a recommendation to buy or sell any stock, and does not take account of your objectives, or your financial situation. We aim to bring you long-term focused analysis driven by fundamental data. Note that our analysis may not factor in the latest price-sensitive company announcements or qualitative material. Simply Wall St has no position in any stocks mentioned.
Have feedback on this article? Concerned about the content? Get in touch with us directly. Alternatively, email editorial-team@simplywallst.com