
- PREMIUM
- LIVE QUOTES
- INSTITUTION
 Index Options
 State Street
 CME Group
 Nasdaq
 Cboe
Cboe TradingView
 Wall Street Journal
Does Huntington Bancshares Still Offer Value After Recent Share Price Gains?
- If you are wondering whether Huntington Bancshares offers good value at today’s price, or if the easy money has already been made, this article is for you.
- The stock has crept up to around $16.90, with returns of 3.7% over the last week and 10.5% over the last month, but is still roughly flat over the past year despite gaining 63.7% over five years.
- Recent moves in regional bank sentiment, shifting expectations around interest rates, and ongoing debates about credit quality and deposit stability have all helped reshape how investors see Huntington’s risk profile. At the same time, renewed attention on bank capital requirements and loan growth potential has kept the stock on many value and income investors’ watchlists.
- Right now, Huntington Bancshares scores a 3/6 valuation score, suggesting some value signals are flashing green while others are more muted. We will walk through those traditional valuation approaches before finishing with a more holistic way to think about what the stock is really worth.
Find out why Huntington Bancshares's -0.3% return over the last year is lagging behind its peers.
Approach 1: Huntington Bancshares Excess Returns Analysis
The Excess Returns model looks at how much profit a company can generate above the return that shareholders demand on their equity, then capitalizes those extra earnings into an intrinsic value per share.
For Huntington Bancshares, the model starts with a Book Value of $13.37 per share and a Stable EPS estimate of $1.75 per share, based on weighted future Return on Equity forecasts from 14 analysts. With an Average Return on Equity of 11.90%, Huntington is expected to earn more on its equity base than the Cost of Equity, which is estimated at $1.08 per share.
The difference between what investors require and what the bank is expected to earn translates into an Excess Return of $0.68 per share. Using a Stable Book Value of $14.73 per share, derived from estimates by 13 analysts, these excess returns are projected forward and discounted back to arrive at an intrinsic value of about $31.40 per share.
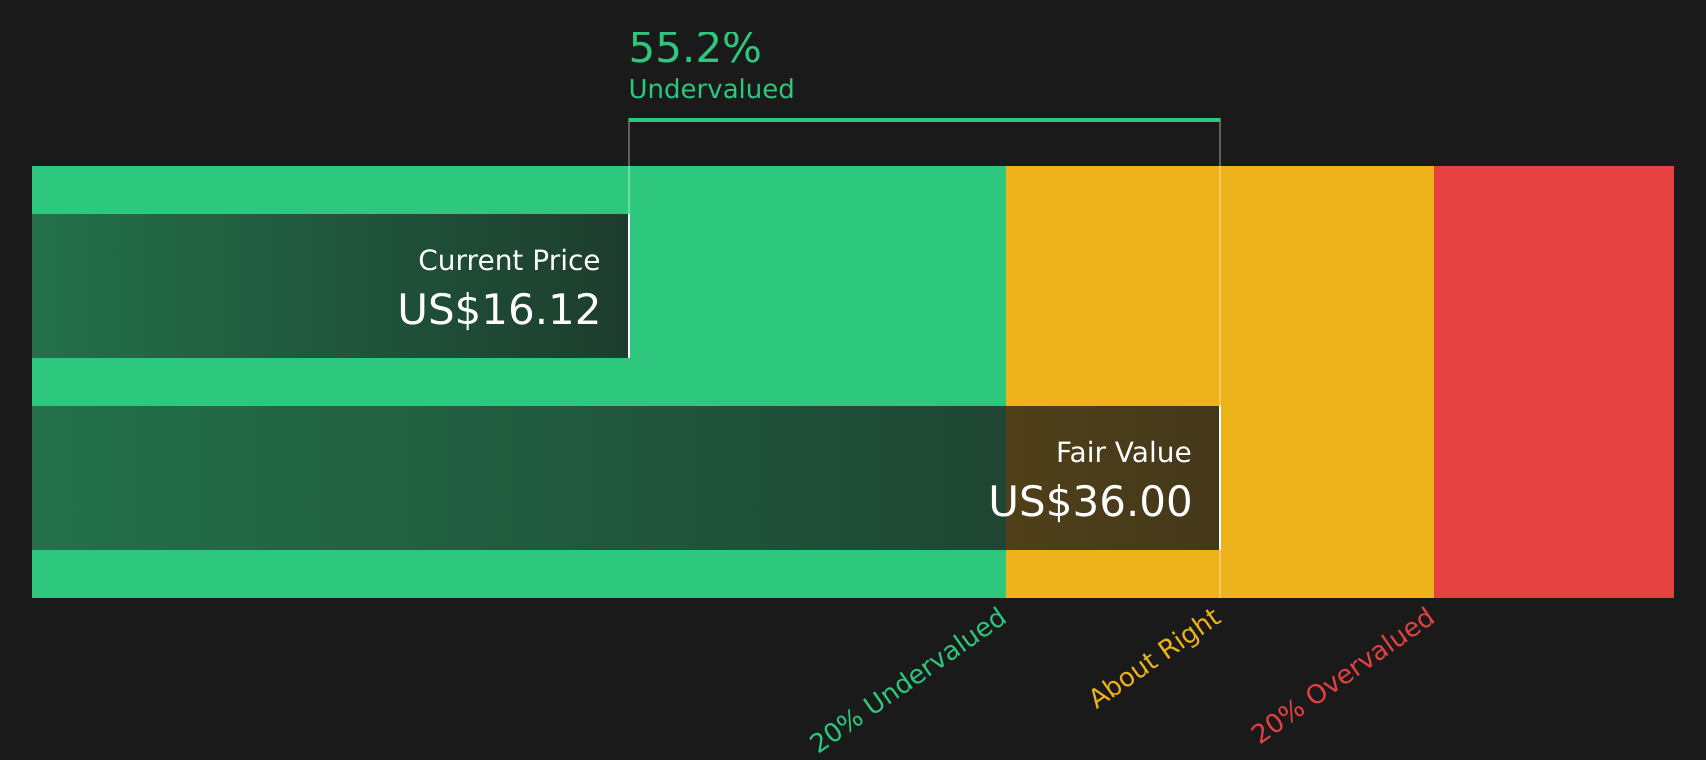
Compared with the recent share price around $16.90, the Excess Returns model suggests the stock is trading at a discount of roughly 46.2% to this intrinsic value estimate.
Result: UNDERVALUED
Our Excess Returns analysis suggests Huntington Bancshares is undervalued by 46.2%. Track this in your watchlist or portfolio, or discover 906 more undervalued stocks based on cash flows.
Approach 2: Huntington Bancshares Price vs Earnings
For a consistently profitable bank like Huntington Bancshares, the price to earnings ratio is a useful way to gauge how much investors are willing to pay for each dollar of current earnings. It captures not only today’s profitability, but also the market’s view on how stable and repeatable those earnings will be.
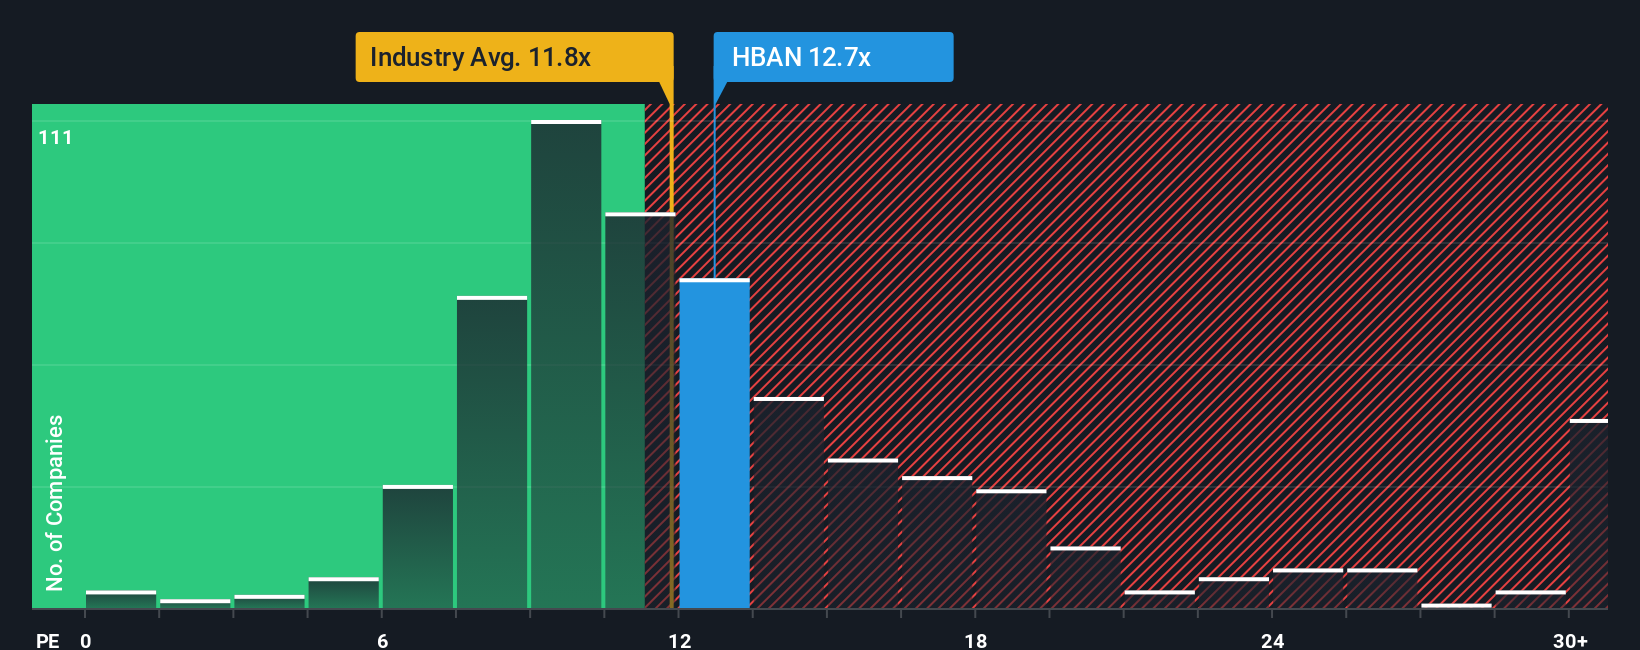
In general, faster expected growth and lower perceived risk justify a higher normal or fair PE, while slower growth or higher risk pull that multiple down. Huntington currently trades at about 12.6x earnings, slightly above the broader Banks industry average of roughly 11.6x and very close to its peer group average of about 12.5x. This suggests the market is pricing it in line with comparable regional banks.
Simply Wall St’s Fair Ratio framework goes a step further by estimating what PE multiple would be reasonable given Huntington’s specific growth outlook, profit margins, size and risk profile. On this basis, the Fair Ratio comes out materially higher at around 19.7x, implying the shares deserve a richer valuation than both peers and the sector. Comparing the current 12.6x PE to this Fair Ratio suggests Huntington Bancshares still looks undervalued on an earnings multiple basis.
Result: UNDERVALUED
PE ratios tell one story, but what if the real opportunity lies elsewhere? Discover 1442 companies where insiders are betting big on explosive growth.
Upgrade Your Decision Making: Choose your Huntington Bancshares Narrative
Earlier we mentioned that there is an even better way to understand valuation, so let us introduce you to Narratives. This is a simple framework on Simply Wall St’s Community page where you turn your view of a company’s story into specific assumptions for future revenue, earnings, and margins. You can then link those to a financial forecast and fair value, and see in real time how Huntington Bancshares looks by comparing that fair value to today’s price. Narratives automatically update as new news or earnings arrive. For example, a bullish investor might build a narrative around rapid Southeast expansion, strong digital adoption, and operating leverage that supports a fair value near the higher end of current targets around $21. A more cautious investor might focus on integration and regulatory risks and set a narrative closer to the lower end near $15.40. Both can immediately see how their different perspectives translate into different fair values and decisions.
Do you think there's more to the story for Huntington Bancshares? Head over to our Community to see what others are saying!

This article by Simply Wall St is general in nature. We provide commentary based on historical data and analyst forecasts only using an unbiased methodology and our articles are not intended to be financial advice. It does not constitute a recommendation to buy or sell any stock, and does not take account of your objectives, or your financial situation. We aim to bring you long-term focused analysis driven by fundamental data. Note that our analysis may not factor in the latest price-sensitive company announcements or qualitative material. Simply Wall St has no position in any stocks mentioned.
Have feedback on this article? Concerned about the content? Get in touch with us directly. Alternatively, email editorial-team@simplywallst.com