
- PREMIUM
- LIVE QUOTES
- INSTITUTION
 Index Options
 State Street
 CME Group
 Nasdaq
 Cboe
Cboe TradingView
 Wall Street Journal
Is It Too Late to Consider DTE Energy After Steady Dividend Growth and Recent Share Gains?
- Wondering whether DTE Energy at around $131 a share is still worth buying, or if most of the upside is already priced in? You are not alone, and that is exactly what this breakdown will tackle.
- Despite a choppy short term, with the stock down 4.2% over the past week and 2.1% over the past month, DTE is still up 8.4% year to date and 11.6% over the last year, building on multi year gains of 24.2% over 3 years and 45.4% over 5 years.
- Recent share moves have been shaped by a steady flow of regulatory updates and capital investment plans, as investors weigh how new infrastructure spending and evolving utility rules could affect future cash flows and risk. At the same time, broader shifts in sentiment toward utilities as defensive, income oriented plays have influenced how much investors are willing to pay for DTE's earnings and dividends.
- Right now DTE Energy scores a 3/6 valuation check score, suggesting the stock looks undervalued on some metrics but not across the board. In the sections that follow, we will compare different valuation approaches and, by the end, highlight an even more insightful way to judge what DTE is really worth.
Approach 1: DTE Energy Dividend Discount Model (DDM) Analysis
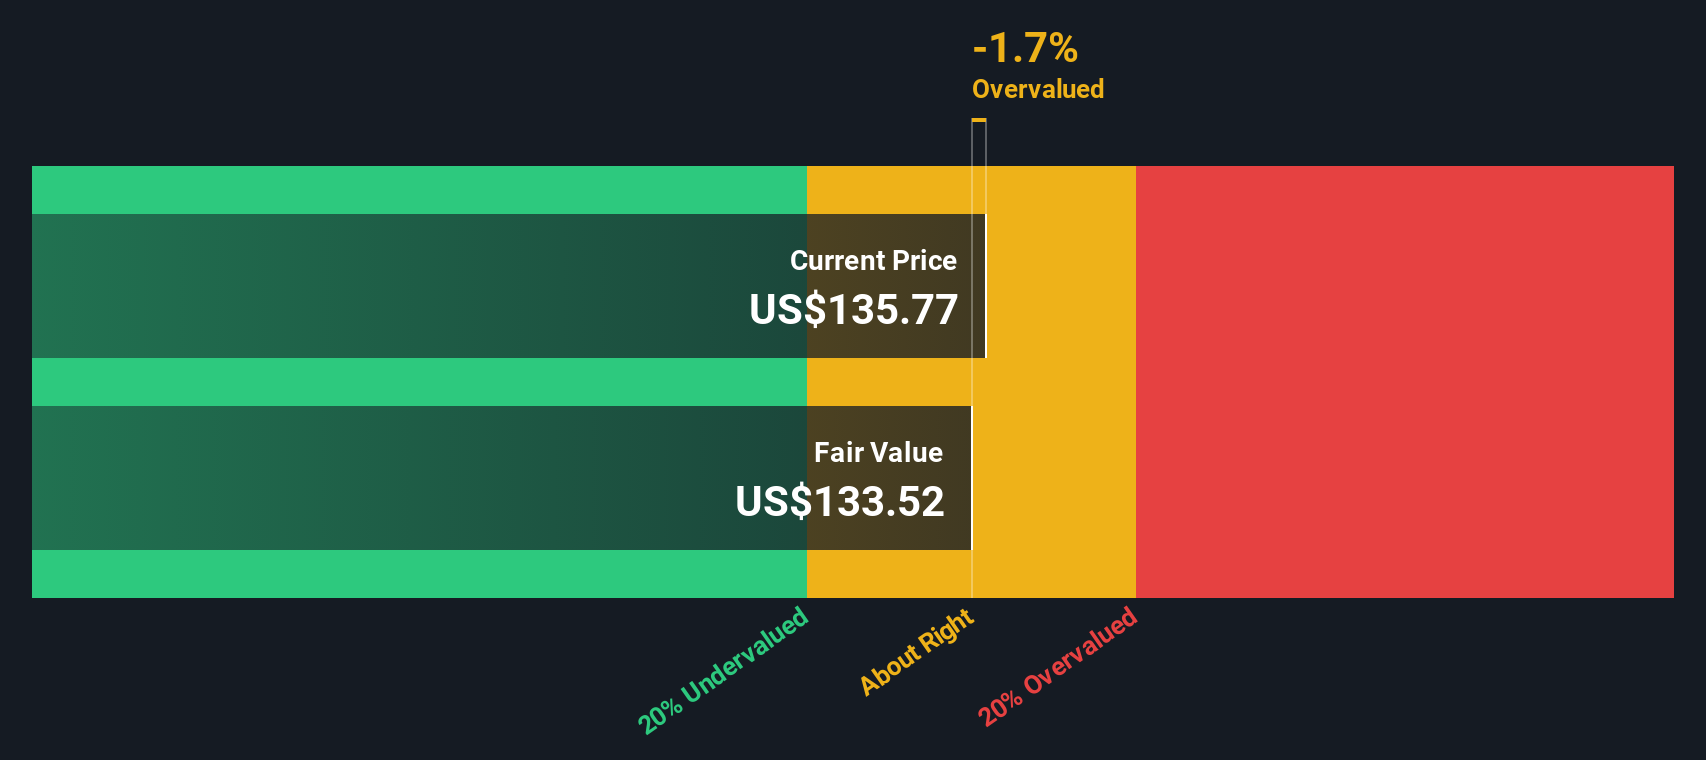
The Dividend Discount Model estimates what a stock is worth by projecting all future dividend payments in $ and discounting them back to today, then comparing that value to the current share price.
For DTE Energy, the model starts with an annual dividend per share of about $4.93. With a return on equity of 12.64% and a payout ratio of roughly 58%, Simply Wall St caps the long term dividend growth rate at 3.26%, slightly below the company’s higher recent growth expectations of about 5.27%. This balance aims to reflect both DTE’s solid profitability and the natural limits on how fast a mature utility can grow its dividends over time.
Using these inputs, the DDM produces an intrinsic value of roughly $133.30 per share, implying the stock is about 1.6% undervalued versus the current price around $131. In valuation terms, that is effectively a close match rather than a major bargain or a clear red flag.
Result: ABOUT RIGHT
DTE Energy is fairly valued according to our Dividend Discount Model (DDM), but this can change at a moment's notice. Track the value in your watchlist or portfolio and be alerted on when to act.
Approach 2: DTE Energy Price vs Earnings
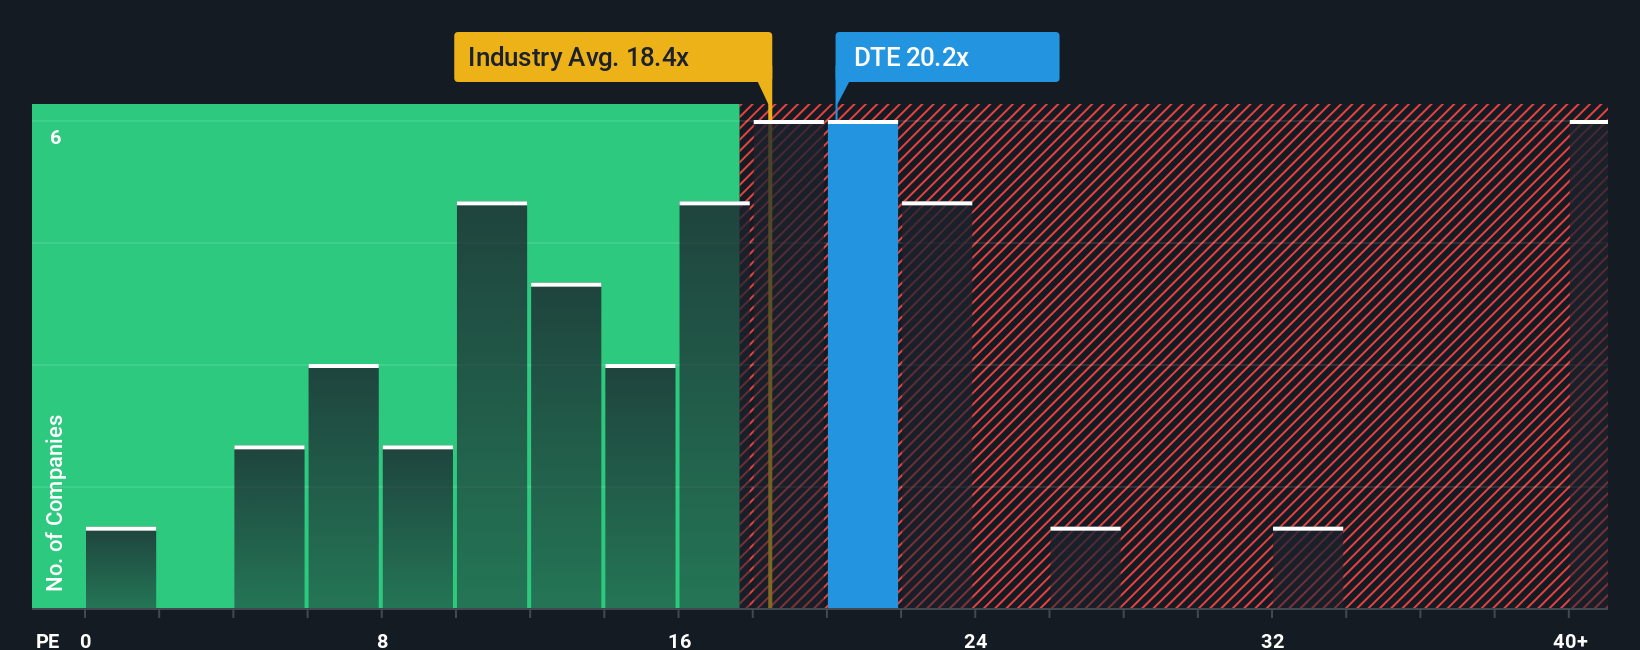
For a profitable, established utility like DTE Energy, the price to earnings, or PE, ratio is a practical way to gauge valuation because it links what investors pay today directly to the company’s current earnings power. In general, faster expected earnings growth and lower perceived risk justify a higher PE multiple, while slower growth or higher risk usually warrant a lower one.
DTE currently trades on a PE of about 19.7x, which is above the broader Integrated Utilities industry average of roughly 17.8x, but slightly below the peer group average of around 21.1x. To move beyond simple comparisons, Simply Wall St uses a proprietary Fair Ratio, which estimates what PE you might reasonably expect for DTE given its earnings growth profile, industry positioning, profit margins, market cap and risk factors.
This Fair Ratio comes out at about 22.9x, which suggests investors could rationally pay a somewhat higher multiple than the current 19.7x. Because the Fair Ratio explicitly incorporates growth and risk, it provides a more tailored benchmark than basic industry or peer averages. On this basis, DTE appears modestly undervalued on earnings.
Result: UNDERVALUED
PE ratios tell one story, but what if the real opportunity lies elsewhere? Discover 1442 companies where insiders are betting big on explosive growth.
Upgrade Your Decision Making: Choose your DTE Energy Narrative
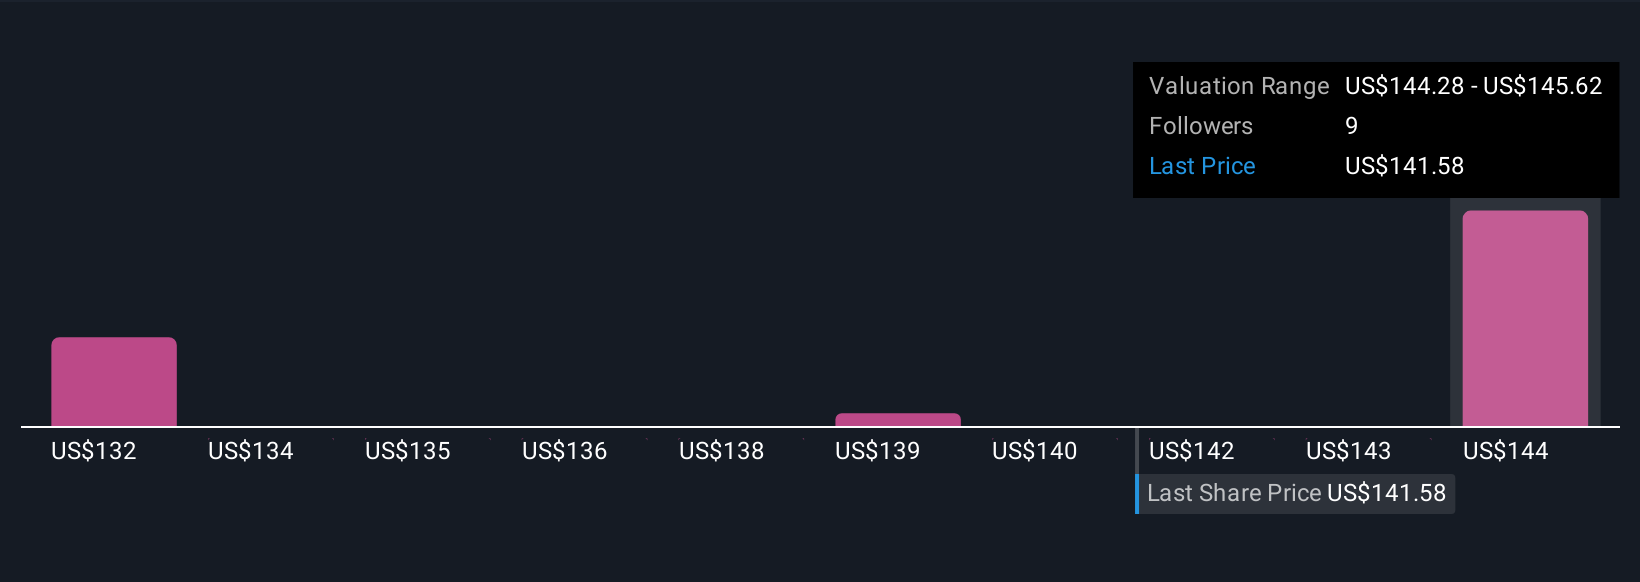
Earlier we mentioned that there is an even better way to understand valuation, so let us introduce you to Narratives, a simple way to connect your view of DTE Energy’s story to a concrete financial forecast and, ultimately, a fair value estimate. A Narrative on Simply Wall St is your own scenario for a company, where you outline how you think revenues, earnings and profit margins will evolve, and the platform then translates that story into an explicit forecast and fair value that you can compare with today’s share price to help inform your decision to buy, hold or sell. Narratives live in the Community section used by millions of investors, are easy to set up, and automatically update when new information such as earnings guidance, regulatory news or analyst revisions comes in, so your fair value stays in sync with reality. For example, some DTE investors might build a bullish Narrative aligned with a fair value near the high end of recent targets around $158, while more cautious investors might anchor to a lower fair value closer to $125. By comparing those Narratives you can quickly see which assumptions you agree with and how much upside or downside you believe is left in the stock.
Do you think there's more to the story for DTE Energy? Head over to our Community to see what others are saying!
This article by Simply Wall St is general in nature. We provide commentary based on historical data and analyst forecasts only using an unbiased methodology and our articles are not intended to be financial advice. It does not constitute a recommendation to buy or sell any stock, and does not take account of your objectives, or your financial situation. We aim to bring you long-term focused analysis driven by fundamental data. Note that our analysis may not factor in the latest price-sensitive company announcements or qualitative material. Simply Wall St has no position in any stocks mentioned.
Have feedback on this article? Concerned about the content? Get in touch with us directly. Alternatively, email editorial-team@simplywallst.com