
- PREMIUM
- LIVE QUOTES
- INSTITUTION
 Index Options
 State Street
 CME Group
 Nasdaq
 Cboe
Cboe TradingView
 Wall Street Journal
Assessing Asbury Automotive Group’s Valuation After Recent Share Price Rebound
- If you have been wondering whether Asbury Automotive Group at around $238.90 is a bargain or a value trap, you are not alone. This stock has all the ingredients to spark a closer look at what you are really paying for.
- Despite being down about 7.8% over the past year, the stock has eked out gains of 2.7% over the last week, 2.2% over the last month, and is modestly positive at 1.0% year to date. This hints that sentiment may be turning after a choppy stretch.
- Recent moves in the share price have come as investors digest ongoing consolidation in the auto retail space and Asbury's continued focus on high margin used vehicles and service operations. The market is weighing how resilient those strategic moves are against softer unit volumes across the broader auto industry and lingering concerns around affordability.
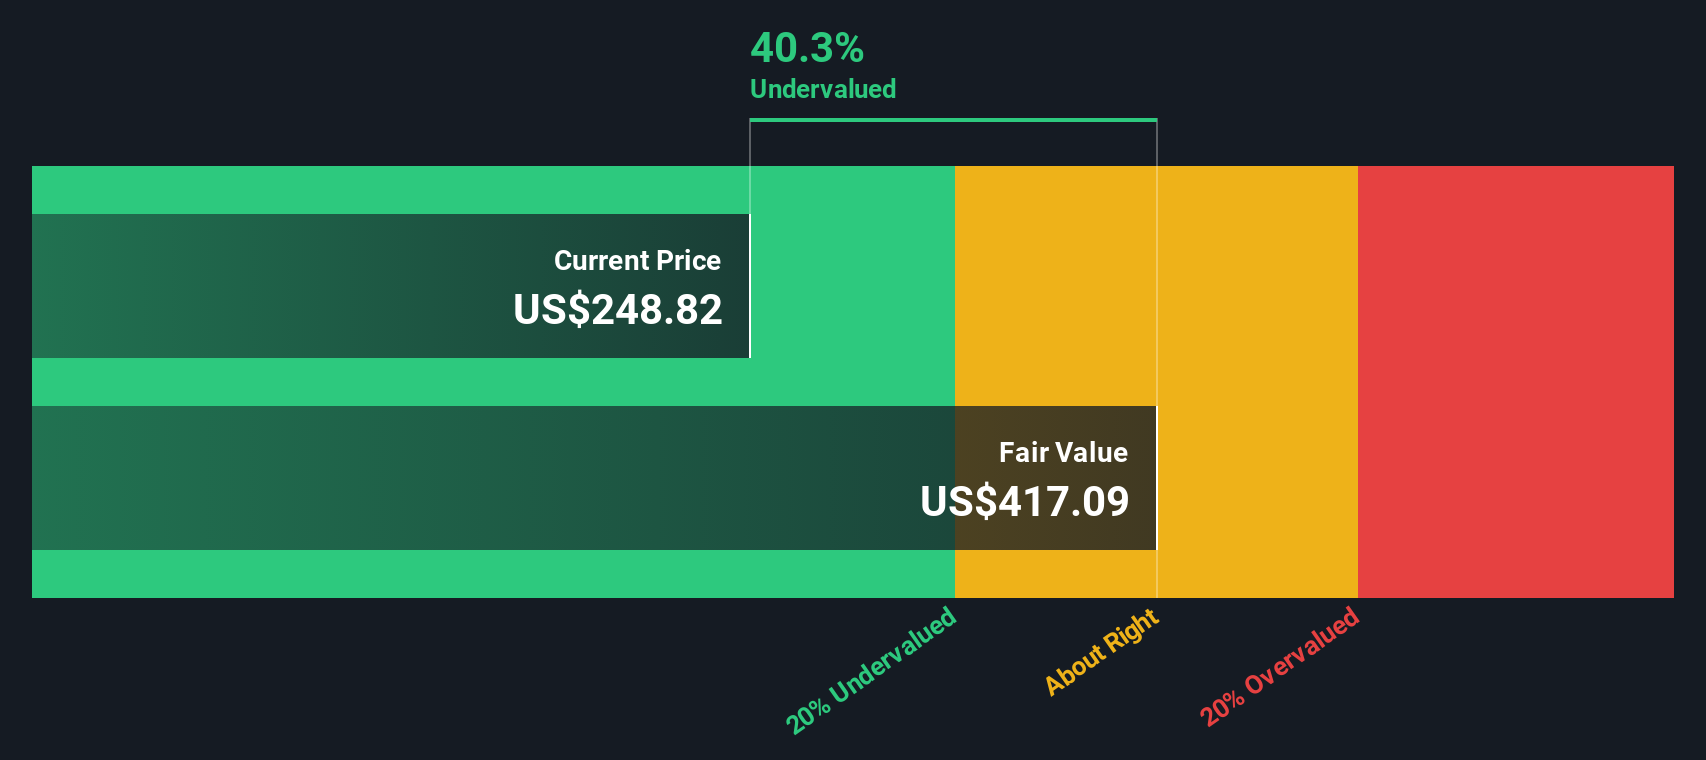
- On our numbers, Asbury scores a solid 5 out of 6 on valuation checks, suggesting it screens as undervalued on most metrics. Next we will unpack how different valuation approaches arrive at that view and why there may be an even better way to think about fair value by the end of this article.
Find out why Asbury Automotive Group's -7.8% return over the last year is lagging behind its peers.
Approach 1: Asbury Automotive Group Discounted Cash Flow (DCF) Analysis
A Discounted Cash Flow model estimates what a business is worth by projecting the cash it can generate in the future and discounting those cash flows back to today in dollar terms.
For Asbury Automotive Group, the 2 Stage Free Cash Flow to Equity model starts with last twelve months free cash flow of about $707 million, then applies analyst forecasts and longer term extrapolations. Analysts see free cash flow at roughly $849 million by 2027, and Simply Wall St extends this path to around $950 million by 2035, with growth gradually slowing as the business matures.
When all those projected cash flows are discounted back to today, the model arrives at an intrinsic value of about $442.49 per share. Compared with the recent share price around $238.90, the DCF implies the stock trades at roughly a 46.0% discount. This suggests the market is pricing in a much weaker cash flow outlook than this model assumes.
Result: UNDERVALUED
Our Discounted Cash Flow (DCF) analysis suggests Asbury Automotive Group is undervalued by 46.0%. Track this in your watchlist or portfolio, or discover 906 more undervalued stocks based on cash flows.
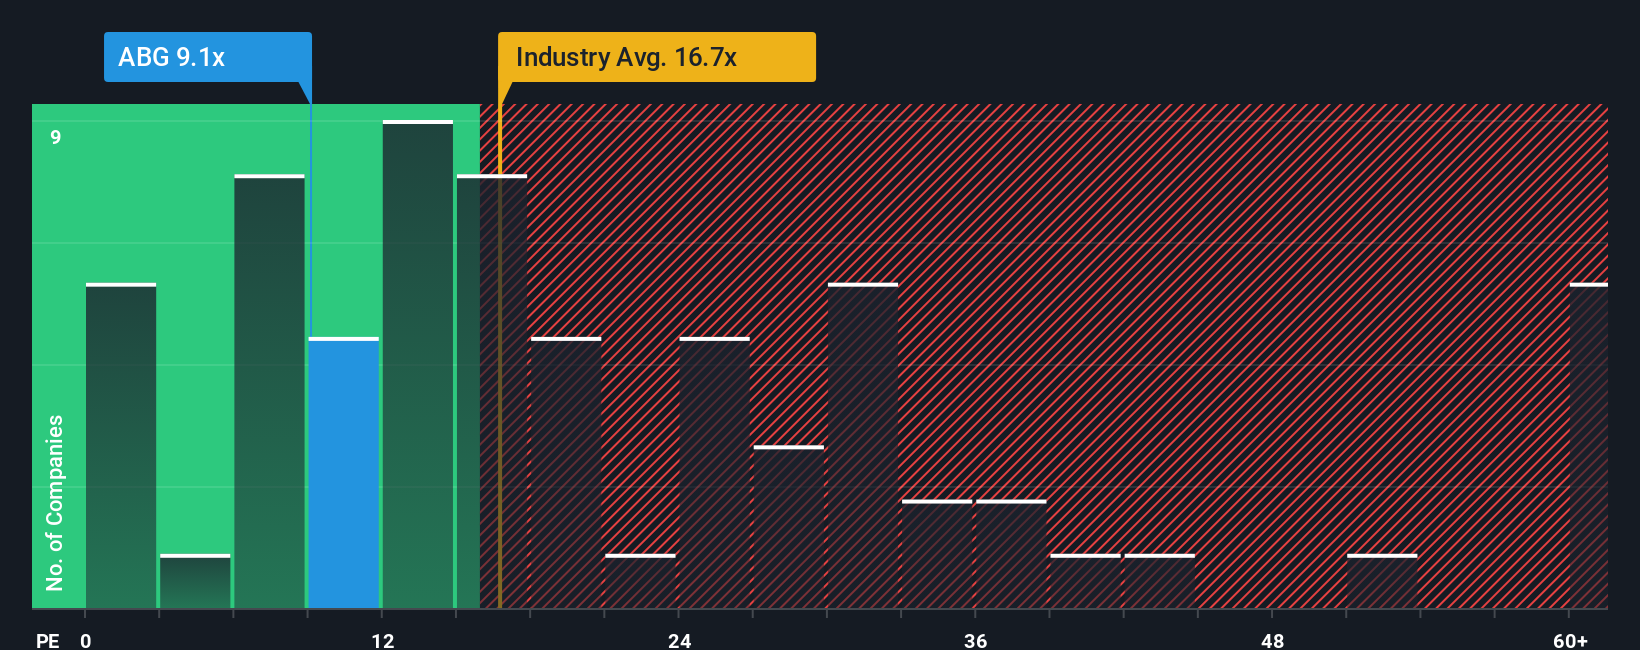
Approach 2: Asbury Automotive Group Price vs Earnings
For profitable companies like Asbury Automotive Group, the price to earnings, or PE, ratio is a practical way to gauge what investors are paying for each dollar of current earnings. In general, faster growth and lower risk justify a higher PE, while slower, more volatile businesses typically deserve a lower multiple.
Asbury currently trades on a PE of about 8.3x, which is well below both the Specialty Retail industry average of roughly 18.8x and the peer group average of about 12.8x. Simply Wall St also calculates a Fair Ratio of 15.1x, which reflects what the PE might reasonably be given Asbury’s earnings growth profile, margins, industry, market cap and specific risk factors.
This Fair Ratio is more informative than a simple comparison to peers or the industry, because it adjusts for the company’s own fundamentals rather than assuming all retailers deserve the same multiple. With Asbury’s actual PE of 8.3x sitting materially below the 15.1x Fair Ratio, the shares appear attractively priced on earnings.
Result: UNDERVALUED
PE ratios tell one story, but what if the real opportunity lies elsewhere? Discover 1442 companies where insiders are betting big on explosive growth.
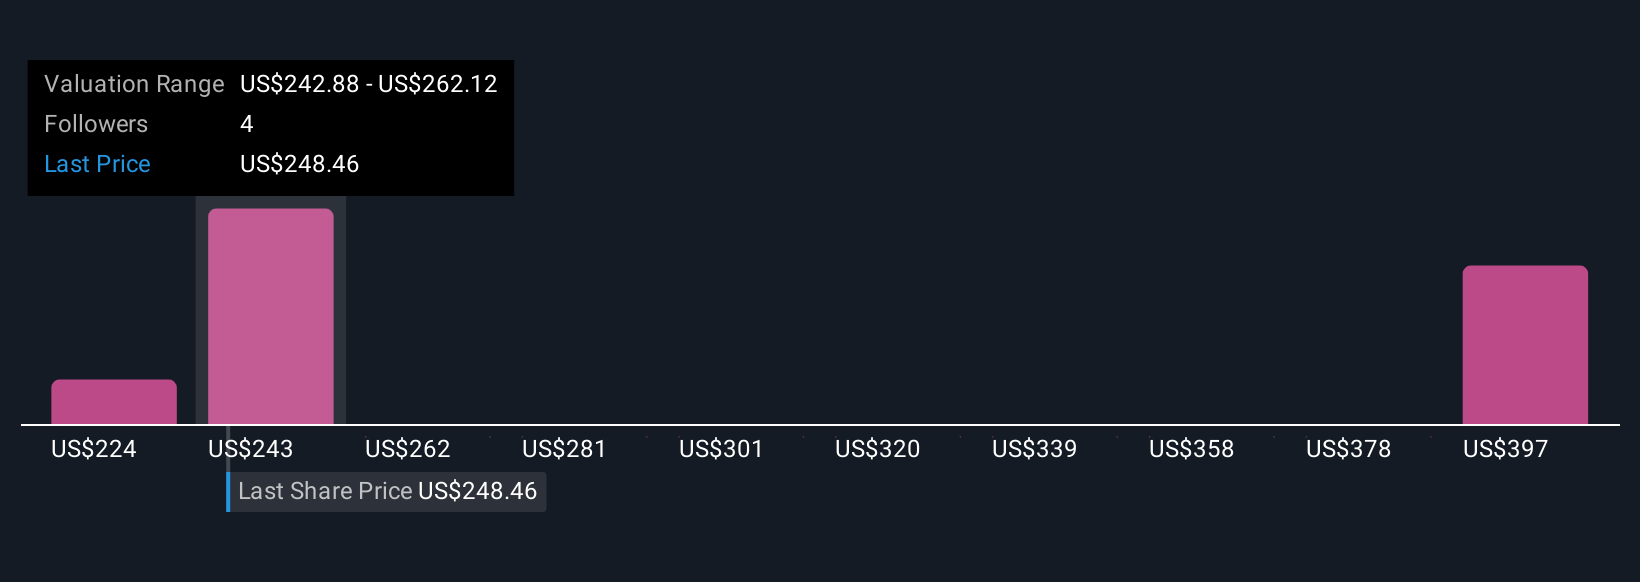
Upgrade Your Decision Making: Choose your Asbury Automotive Group Narrative
Earlier we mentioned that there is an even better way to understand valuation, so let us introduce you to Narratives, a simple framework on Simply Wall St’s Community page that lets you attach a clear story and set of assumptions about future revenue, earnings, margins and fair value to a company. You can then continuously link that story to a dynamic forecast and a fair value you can compare with the current share price to inform your own decisions, with the numbers automatically updating as new news or earnings arrive. For example, one Asbury Automotive Group Narrative might lean optimistic and assume analysts’ higher price target of about $335 based on strong luxury expansion, digital retail and stable margins. Another might be more cautious and anchor closer to $215 due to acquisition risk, EV disruption and used car supply constraints. Simply Wall St makes it easy to see and compare these different fair values so you can align your own view with the Narrative that best fits your expectations.
Do you think there's more to the story for Asbury Automotive Group? Head over to our Community to see what others are saying!
This article by Simply Wall St is general in nature. We provide commentary based on historical data and analyst forecasts only using an unbiased methodology and our articles are not intended to be financial advice. It does not constitute a recommendation to buy or sell any stock, and does not take account of your objectives, or your financial situation. We aim to bring you long-term focused analysis driven by fundamental data. Note that our analysis may not factor in the latest price-sensitive company announcements or qualitative material. Simply Wall St has no position in any stocks mentioned.
Have feedback on this article? Concerned about the content? Get in touch with us directly. Alternatively, email editorial-team@simplywallst.com