
- PREMIUM
- LIVE QUOTES
- INSTITUTION
 Index Options
 State Street
 CME Group
 Nasdaq
 Cboe
Cboe TradingView
 Wall Street Journal
Has the Recent Pullback in PSEG Created a Fresh Opportunity for Investors in 2025?
- If you are wondering whether Public Service Enterprise Group is starting to look like a bargain or a value trap, you are not alone. This breakdown aims to unpack that question in more detail.
- The stock is down 4.7% over the last week and 6.5% year to date, but those pullbacks sit on top of longer term gains of 46.1% over three years and 65.3% over five years.
- Recent headlines have focused on the company’s ongoing investments in regulated transmission and distribution infrastructure, as well as policy developments around clean energy incentives that affect its long term capital plans. Together, these themes help explain why the market has been reassessing both its growth runway and its risk profile.
- Right now, Public Service Enterprise Group only scores 1 out of 6 on our undervaluation checks. We will walk through what that means under different valuation approaches, and then finish with a more complete way to think about what the stock is really worth.
Public Service Enterprise Group scores just 1/6 on our valuation checks. See what other red flags we found in the full valuation breakdown.
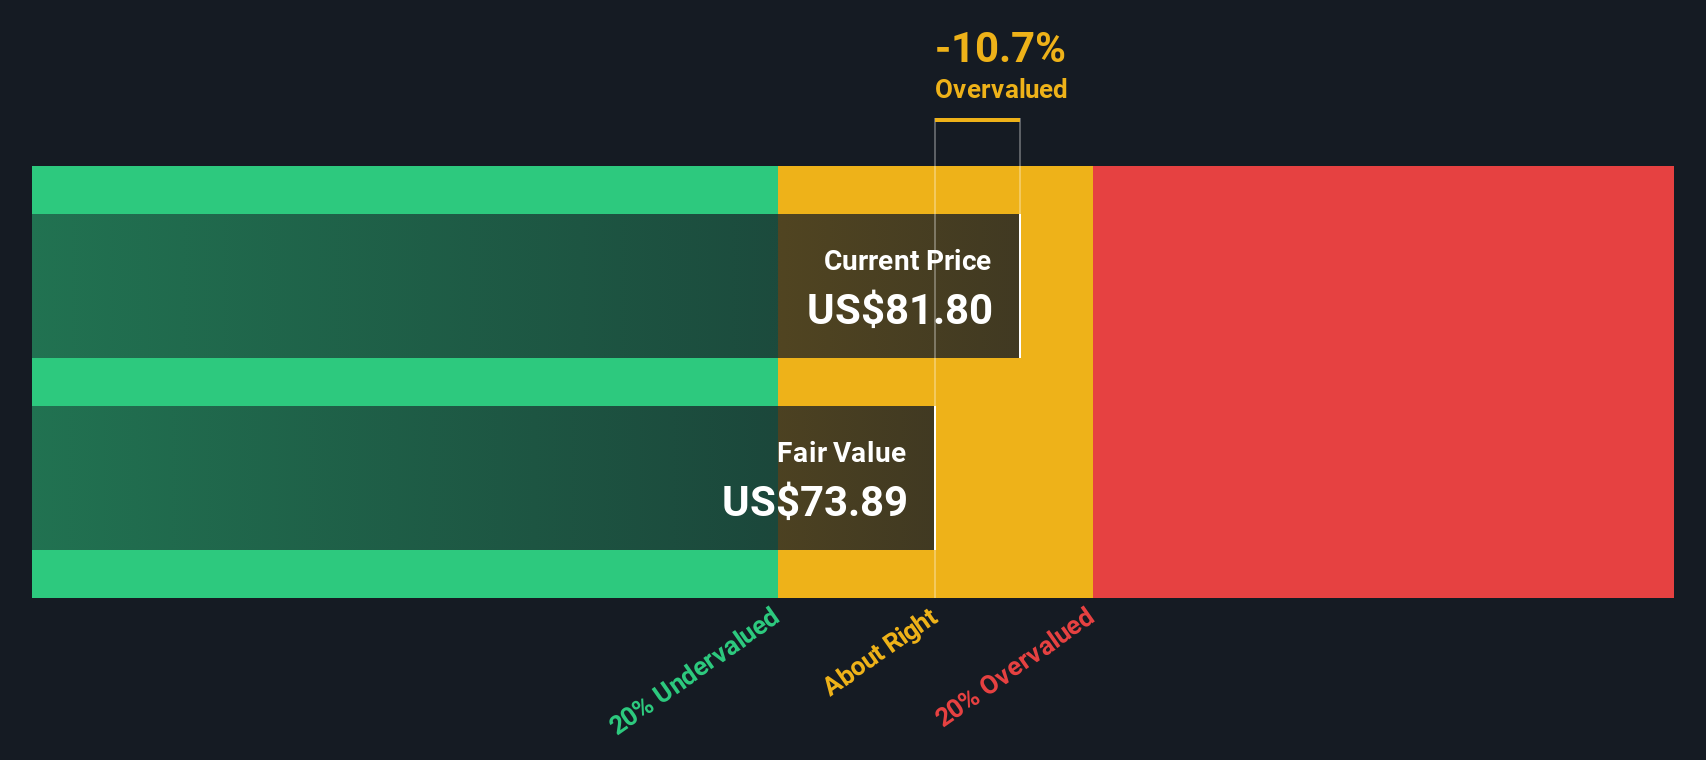
Approach 1: Public Service Enterprise Group Dividend Discount Model (DDM) Analysis
The Dividend Discount Model estimates what a stock is worth by projecting all future dividend payments and discounting them back to today. It is best suited to mature, dividend paying businesses like Public Service Enterprise Group.
In this framework, Public Service Enterprise Group currently pays an annual dividend per share of about $2.79, supported by a return on equity of roughly 12.2% and a payout ratio of about 62%. That payout level suggests the dividend is reasonably sustainable while still leaving room to reinvest in the business. Simply Wall St caps the long term dividend growth rate at 3.26%, even though the underlying earnings growth assumption is closer to 4.6%, to avoid overestimating future payouts.
Feeding these inputs into the DDM produces an intrinsic value estimate of about $75.40 per share. With the model indicating the stock is roughly 5.5% overvalued relative to the current price, Public Service Enterprise Group appears close to fairly priced rather than clearly cheap or expensive.
Result: ABOUT RIGHT
Public Service Enterprise Group is fairly valued according to our Dividend Discount Model (DDM), but this can change at a moment's notice. Track the value in your watchlist or portfolio and be alerted on when to act.
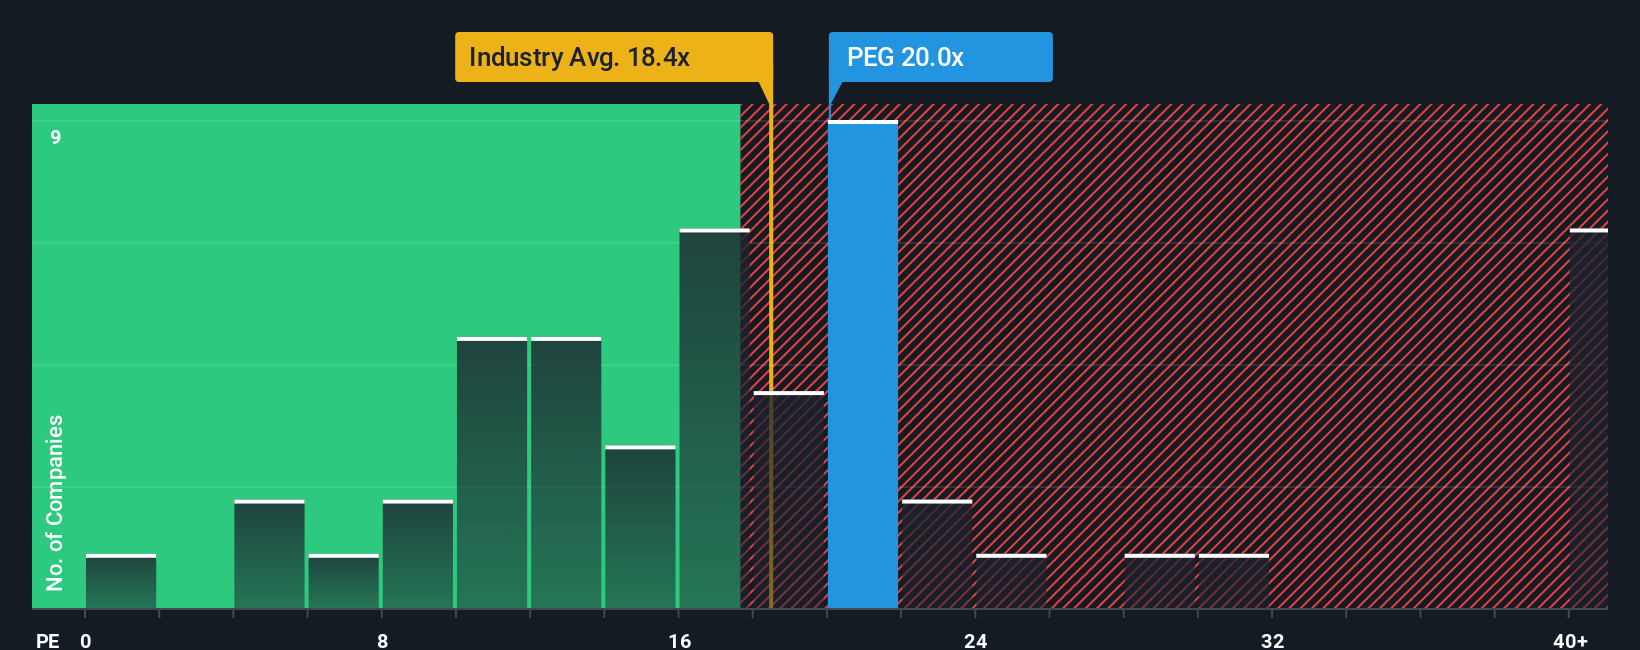
Approach 2: Public Service Enterprise Group Price vs Earnings
For consistently profitable companies like Public Service Enterprise Group, the price to earnings ratio is a useful yardstick because it directly links what investors pay today to the profits the business is already generating. In general, faster growth and lower risk justify paying a higher PE multiple, while slower growth or higher uncertainty call for a lower, more conservative range.
Public Service Enterprise Group currently trades at about 19.1x earnings, which sits slightly above the Integrated Utilities industry average of roughly 17.8x and very close to the broader peer group at around 18.9x. Simply Wall St goes a step further by estimating a Fair Ratio of about 23.0x for Public Service Enterprise Group, based on its specific mix of earnings growth prospects, profitability, industry positioning, market cap and risk profile. This tailored Fair Ratio is more informative than a simple peer or industry comparison because it adjusts for the company’s own fundamentals rather than assuming all utilities deserve the same multiple. With the current multiple below the Fair Ratio, the shares screen as modestly undervalued on a PE basis.
Result: UNDERVALUED
PE ratios tell one story, but what if the real opportunity lies elsewhere? Discover 1442 companies where insiders are betting big on explosive growth.
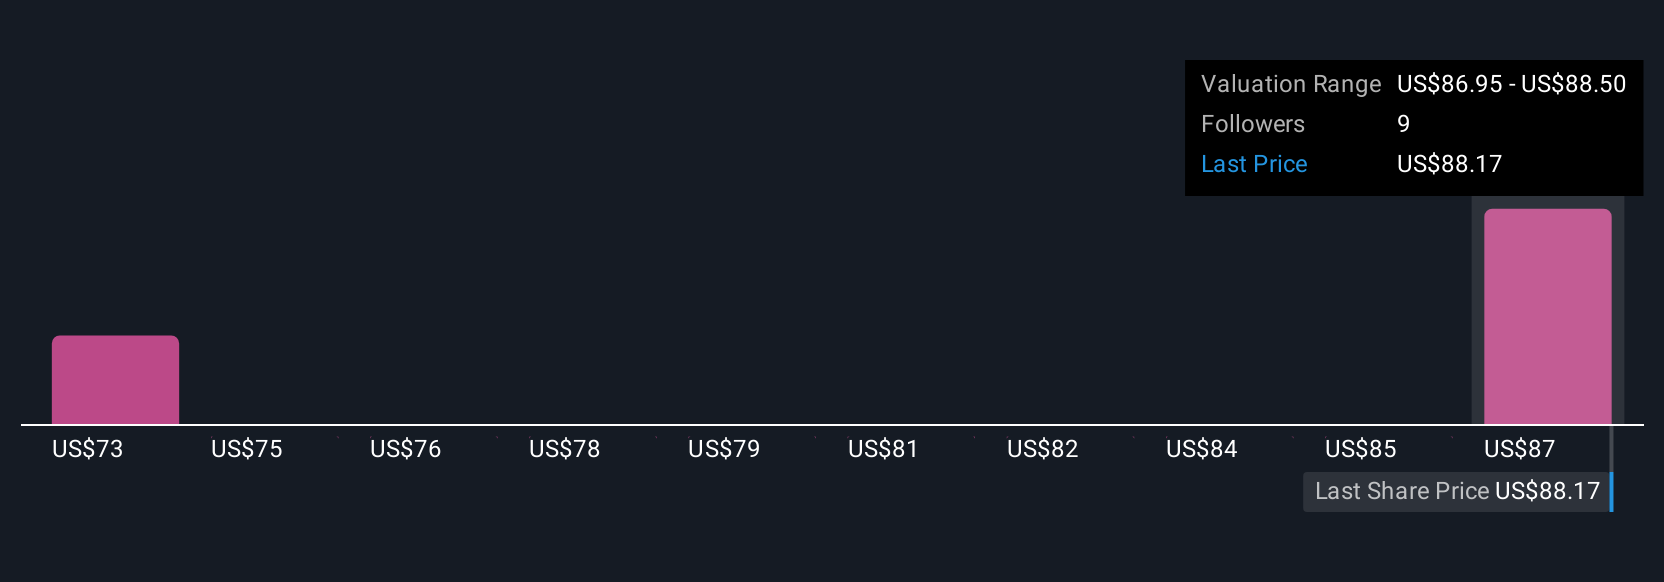
Upgrade Your Decision Making: Choose your Public Service Enterprise Group Narrative
Earlier we mentioned that there is an even better way to understand valuation, so let us introduce you to Narratives, which are simply your story about a company tied directly to your numbers such as fair value, and your expectations for future revenue, earnings, and margins. A Narrative connects three pieces together in a single, easy to use framework: the business story you believe, the financial forecast that flows from that story, and the fair value that those numbers imply today. On Simply Wall St, millions of investors share Narratives on the Community page, where you can quickly see how their fair values compare with the current share price to help you decide how a stock might fit into your portfolio. These Narratives update dynamically as new information arrives, such as fresh earnings or major news, so your view of Public Service Enterprise Group does not go stale. One Public Service Enterprise Group Narrative might focus on strong grid investment and clean energy tailwinds and land on a fair value near $105. Another, more cautious Narrative that emphasizes regulatory and data center demand risks might only justify something closer to $71.
Do you think there's more to the story for Public Service Enterprise Group? Head over to our Community to see what others are saying!
This article by Simply Wall St is general in nature. We provide commentary based on historical data and analyst forecasts only using an unbiased methodology and our articles are not intended to be financial advice. It does not constitute a recommendation to buy or sell any stock, and does not take account of your objectives, or your financial situation. We aim to bring you long-term focused analysis driven by fundamental data. Note that our analysis may not factor in the latest price-sensitive company announcements or qualitative material. Simply Wall St has no position in any stocks mentioned.
Have feedback on this article? Concerned about the content? Get in touch with us directly. Alternatively, email editorial-team@simplywallst.com