
- PREMIUM
- LIVE QUOTES
- INSTITUTION
 Index Options
 State Street
 CME Group
 Nasdaq
 Cboe
Cboe TradingView
 Wall Street Journal
Is It Time To Reassess NextEra Energy After Its 2025 Share Price Rally?
- Wondering if NextEra Energy is still attractively priced today, or if the best days are already reflected in the share price? Here is a closer look at what recent moves and fundamentals might be indicating about value.
- After a strong run with shares up 16.1% year to date and 13.9% over the last year, the stock has cooled slightly in the last week, slipping 3.7% while still holding a 1.2% gain over the past month. That mix of momentum and near term softness can indicate either a healthy pause or the beginning of a broader reassessment of risk.
- Investors have been responding to a steady stream of updates related to the energy transition, including NextEra's continued build out of renewables projects and regulatory developments that affect how utilities can recover grid and investment costs. At the same time, sector wide discussions about interest rates and capital intensive infrastructure have kept utility valuations in focus and influenced how the market prices companies like NextEra.
- Right now, NextEra scores a 1 out of 6 on our valuation checks, indicating that it appears undervalued on only one of the key metrics tracked. The sections ahead outline what different valuation approaches suggest about the stock, followed by a more holistic way to think about its longer term value profile.
NextEra Energy scores just 1/6 on our valuation checks. See what other red flags we found in the full valuation breakdown.
Approach 1: NextEra Energy Dividend Discount Model (DDM) Analysis
The Dividend Discount Model estimates what a stock is worth by projecting all future dividends a company is expected to pay, then discounting those payments back to today based on a required return. It is especially useful for mature, dividend paying businesses like utilities.
For NextEra Energy, the model uses a current annual dividend per share of about $2.57 and a payout ratio close to 61%, meaning a little over half of earnings are being returned to shareholders as dividends. With return on equity around 9.5% and an expected long term dividend growth rate capped at about 3.3%, the model assumes steady but not explosive income growth over time.
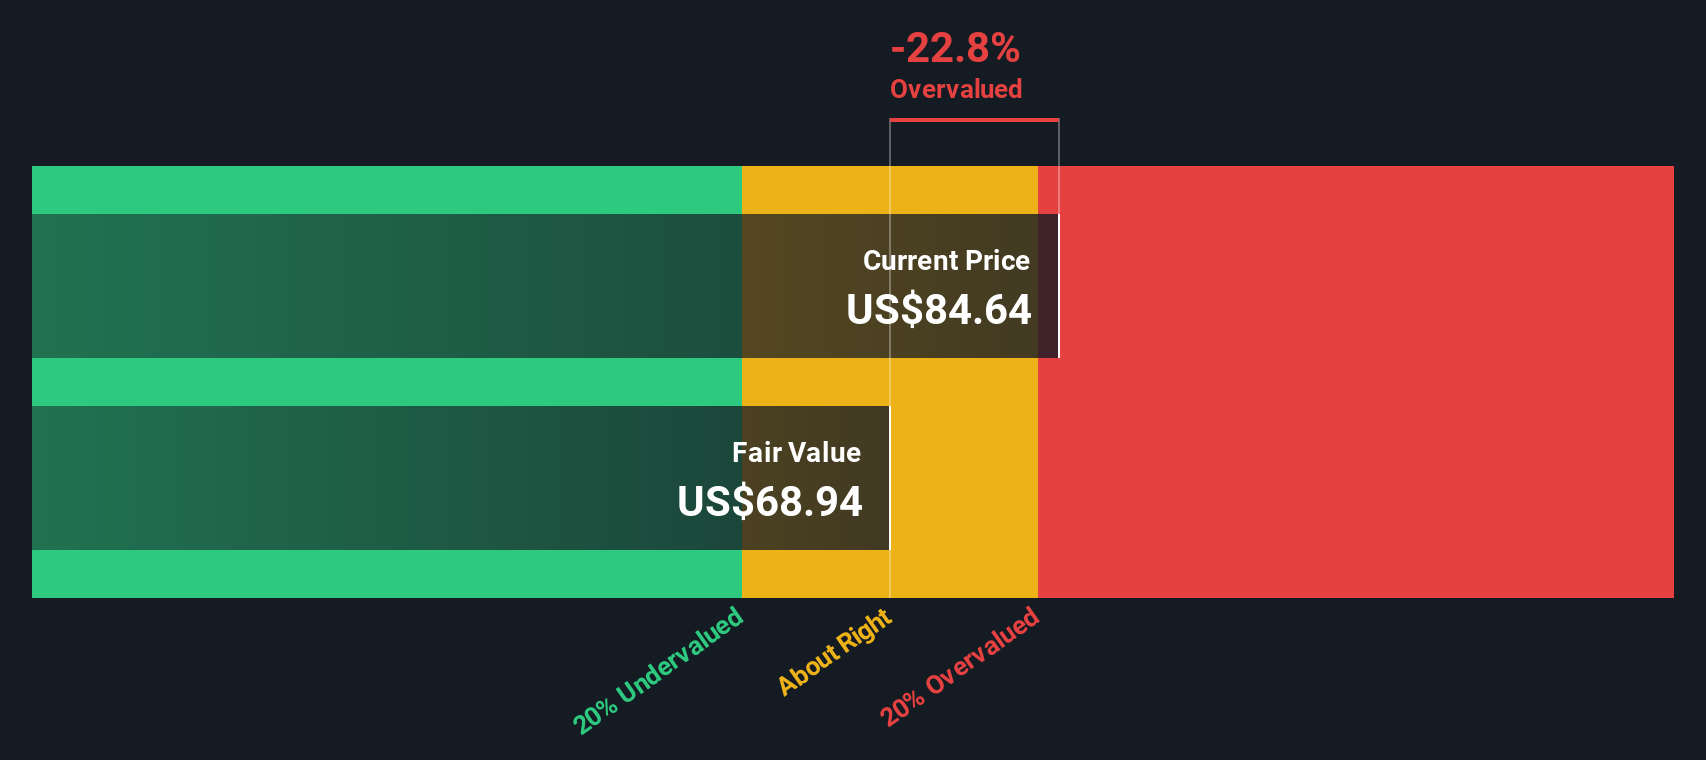
Based on these inputs, the DDM framework estimates an intrinsic value of roughly $69.51 per share. Compared with the current market price, this implies the stock is about 19.6% overvalued. This suggests investors are paying a premium for NextEra’s perceived stability and growth profile.
Result: OVERVALUED
Our Dividend Discount Model (DDM) analysis suggests NextEra Energy may be overvalued by 19.6%. Discover 906 undervalued stocks or create your own screener to find better value opportunities.
Approach 2: NextEra Energy Price vs Earnings
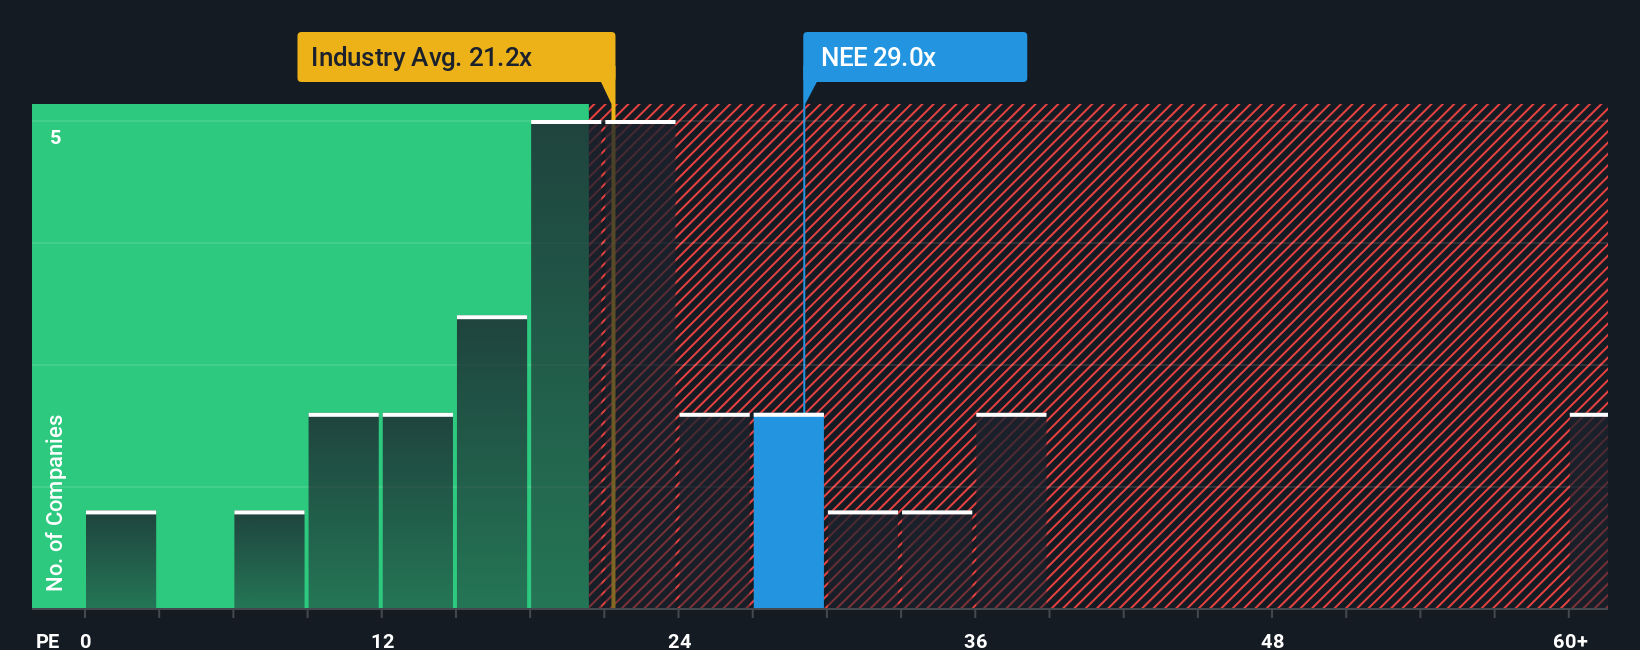
For profitable companies like NextEra Energy, the price to earnings, or PE, ratio is a practical way to gauge what investors are willing to pay for each dollar of current earnings. In general, faster growth and lower perceived risk can justify a higher PE, while slower growth or higher uncertainty usually call for a lower, more conservative multiple.
NextEra currently trades at about 26.6x earnings, a premium to the broader Electric Utilities industry average of roughly 19.9x and slightly above the peer average of around 24.5x. To move beyond these simple comparisons, Simply Wall St uses a proprietary Fair Ratio, which estimates what a more appropriate PE might be after factoring in elements like NextEra’s earnings growth outlook, profitability, industry positioning, size and risk profile.
This Fair Ratio for NextEra is about 29.5x, which indicates that the stock’s current PE is somewhat below where it might reasonably trade based on its fundamentals and risk adjusted growth prospects. While peers and the sector offer useful context, the Fair Ratio provides a more tailored benchmark, and in this case it points to the shares looking modestly undervalued on a PE basis.
Result: UNDERVALUED
PE ratios tell one story, but what if the real opportunity lies elsewhere? Discover 1442 companies where insiders are betting big on explosive growth.
Upgrade Your Decision Making: Choose your NextEra Energy Narrative
Earlier we mentioned that there is an even better way to understand valuation, so let us introduce you to Narratives, a simple way to connect your view of a company’s future to the numbers behind its fair value.
A Narrative is your story about a business, where you spell out how you think revenue, earnings and margins might evolve, and then link that story directly to a financial forecast and a resulting fair value estimate.
On Simply Wall St, millions of investors use Narratives on the Community page to turn high level views into clear, quantitative scenarios. These scenarios show whether a stock looks undervalued or overvalued by comparing their Fair Value to today’s Price, helping them decide when to buy, hold or sell.
Because Narratives update automatically when new information like earnings reports or major news hits, your fair value and thesis stay alive and current rather than locked in a static model.
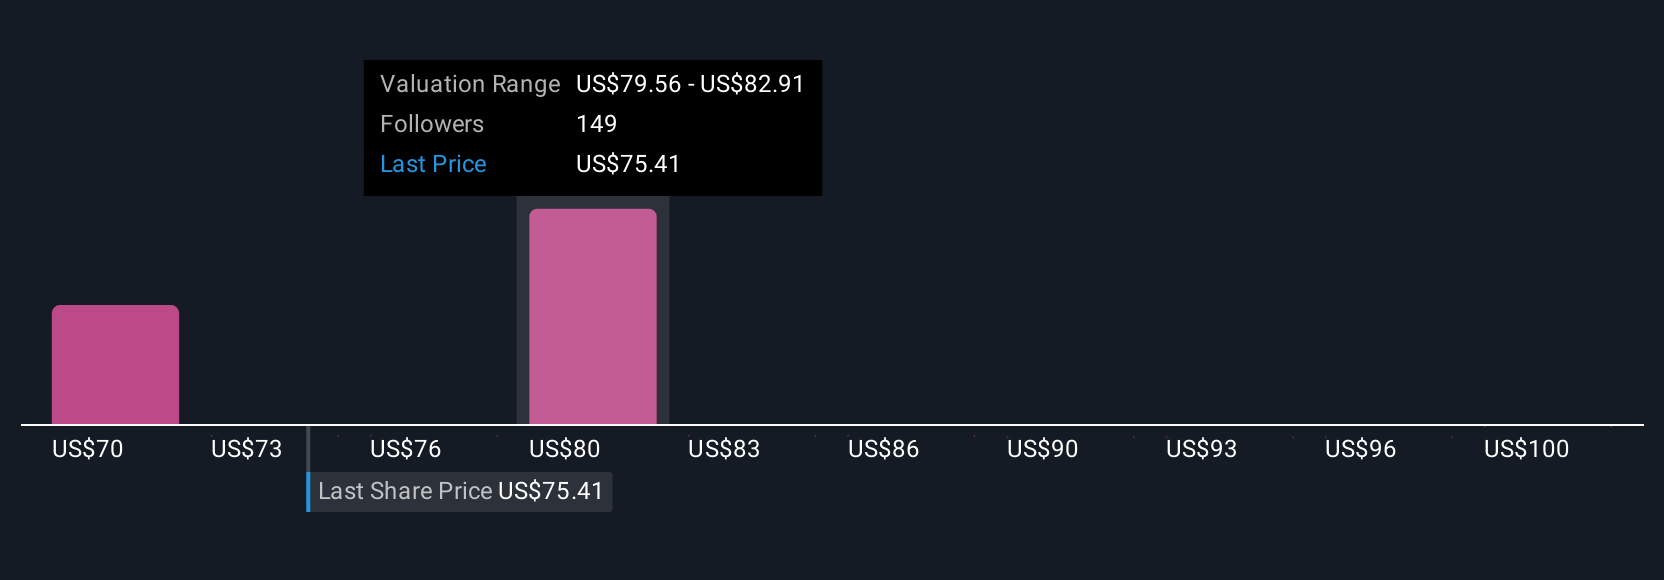
For example, one NextEra Energy investor might build a bullish Narrative that supports a fair value near $103, while a more cautious investor might land closer to $52. Seeing both side by side shows you how different assumptions about growth, margins and risk translate into very different valuation outcomes.
Do you think there's more to the story for NextEra Energy? Head over to our Community to see what others are saying!
This article by Simply Wall St is general in nature. We provide commentary based on historical data and analyst forecasts only using an unbiased methodology and our articles are not intended to be financial advice. It does not constitute a recommendation to buy or sell any stock, and does not take account of your objectives, or your financial situation. We aim to bring you long-term focused analysis driven by fundamental data. Note that our analysis may not factor in the latest price-sensitive company announcements or qualitative material. Simply Wall St has no position in any stocks mentioned.
Have feedback on this article? Concerned about the content? Get in touch with us directly. Alternatively, email editorial-team@simplywallst.com