
- PREMIUM
- LIVE QUOTES
- INSTITUTION
 Index Options
 State Street
 CME Group
 Nasdaq
 Cboe
Cboe TradingView
 Wall Street Journal
Has Eos Energy Enterprises’ 1355% Three Year Surge Left Much Upside for Investors?
- Wondering if Eos Energy Enterprises is still a smart bet after its massive run, or if the upside has already been priced in? This breakdown will help you separate hype from genuine value.
- The stock has cooled a bit recently, slipping around 0.4% over the past week, but that is after a huge move, up about 171.1% year to date and 367.0% over the last year, with a staggering 1355.3% gain over three years.
- Those swings have come as investors focus on Eos as a potential beneficiary of large scale energy storage demand, including utility and grid level projects that could accelerate if commercial adoption keeps building out. At the same time, the market has been reassessing risk around capital intensive clean tech names generally, which helps explain some of the volatility.
- Despite that backdrop, Eos currently scores just 0 out of 6 on our valuation checks. Below, we walk through what different valuation methods say about the stock, then finish with a way to think about valuation that goes beyond any single model.
Eos Energy Enterprises scores just 0/6 on our valuation checks. See what other red flags we found in the full valuation breakdown.
Approach 1: Eos Energy Enterprises Discounted Cash Flow (DCF) Analysis
A Discounted Cash Flow model estimates what a company is worth by projecting its future cash flows and discounting them back to today, adjusting for risk and the time value of money.
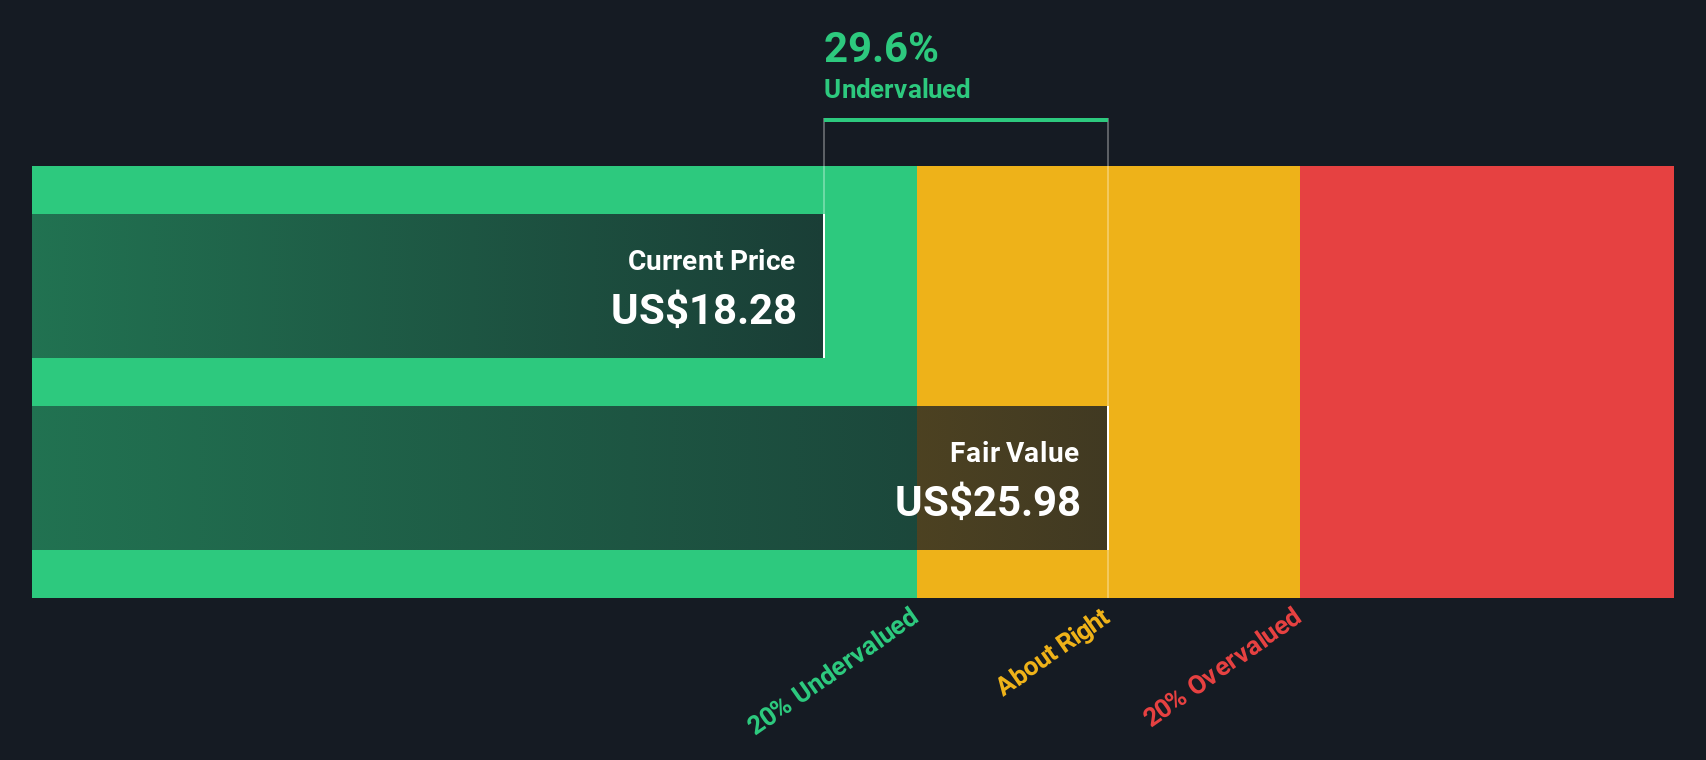
For Eos Energy Enterprises, the latest twelve month free cash flow is deeply negative at about $268.3 Million, reflecting heavy investment and ongoing losses. Analysts expect cash flows to improve over the next few years, turning positive by 2027 and rising to roughly $264.3 Million by 2029. Beyond the first five years, Simply Wall St extrapolates these trends to build a full 2 Stage Free Cash Flow to Equity model.
On this basis, the DCF model arrives at an estimated intrinsic value of about $9.82 per share. Compared with the current market price, this implies the stock is around 52.6% overvalued. This suggests that a lot of future success is already priced in and leaves little margin of safety for investors.
Result: OVERVALUED
Our Discounted Cash Flow (DCF) analysis suggests Eos Energy Enterprises may be overvalued by 52.6%. Discover 906 undervalued stocks or create your own screener to find better value opportunities.
Approach 2: Eos Energy Enterprises Price vs Book
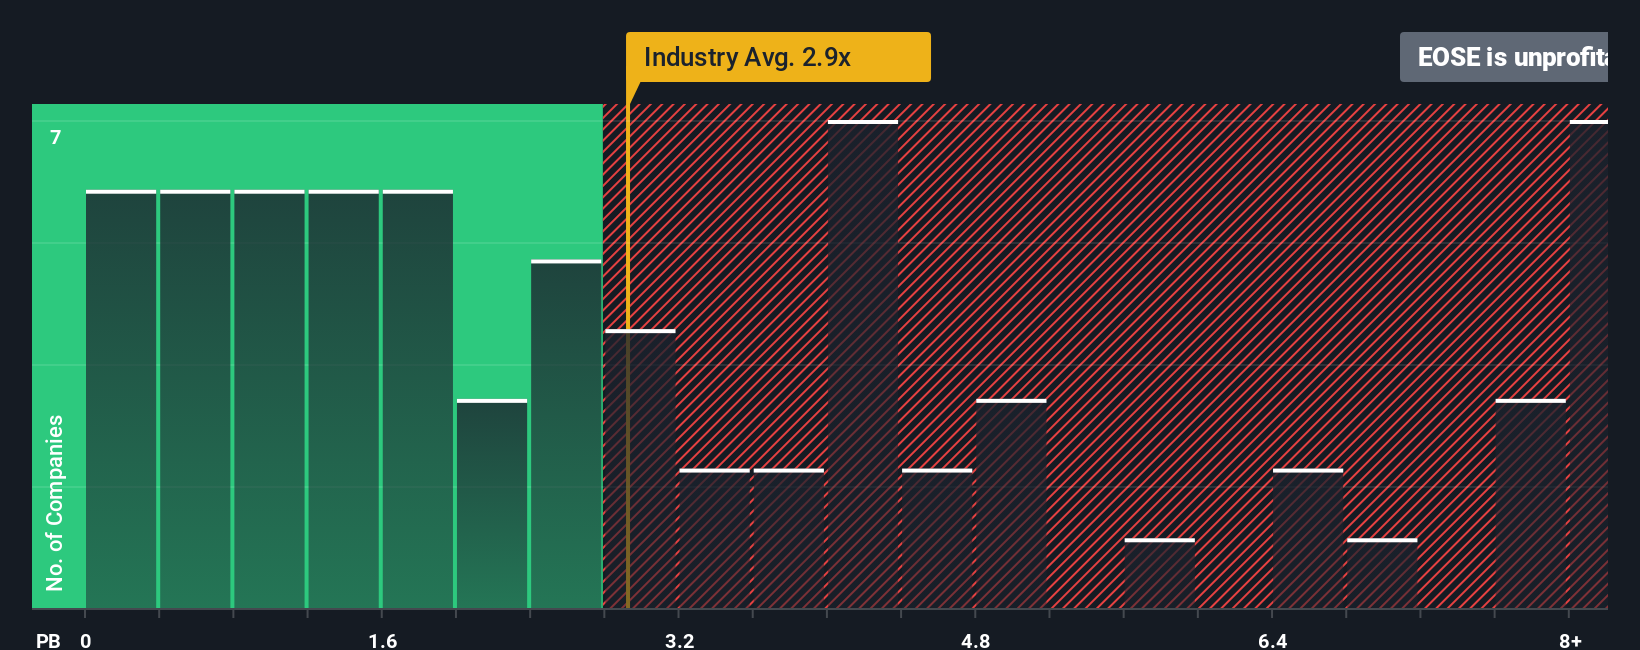
For many profitable companies, the Price to Book, or P B, ratio is a useful way to gauge how much investors are paying for each dollar of net assets, especially in capital intensive sectors where tangible assets and balance sheet strength matter.
In general, faster growth and lower perceived risk justify a higher P B multiple, while slower growth and higher uncertainty point to a lower, more conservative range. So what looks fair for one company might be excessive for another, even within the same industry.
Eos Energy Enterprises currently trades at around 2.09x book value, compared with the broader Electrical industry average of about 2.49x and a peer group average of roughly 4.63x. Simply Wall St also calculates a proprietary Fair Ratio, which estimates the P B multiple the stock should trade at after considering its growth outlook, profitability potential, risk profile, industry positioning, and market cap. This Fair Ratio framework is more informative than a simple peer or industry comparison because it adjusts for company specific strengths and weaknesses rather than assuming all players deserve similar valuations. With the Fair Ratio coming out meaningfully above the current 2.09x, Eos screens as undervalued on this metric.
Result: UNDERVALUED
PB ratios tell one story, but what if the real opportunity lies elsewhere? Discover 1442 companies where insiders are betting big on explosive growth.
Upgrade Your Decision Making: Choose your Eos Energy Enterprises Narrative
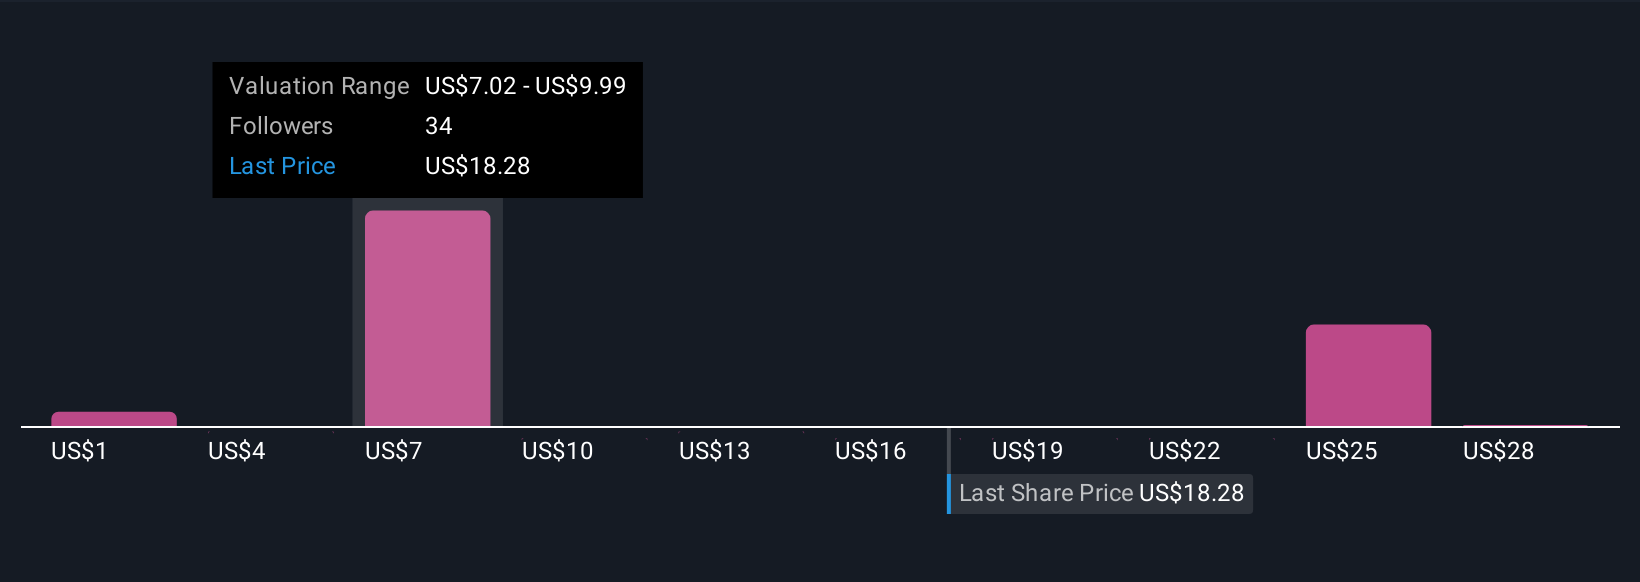
Earlier we mentioned that there is an even better way to understand valuation, so let us introduce you to Narratives, which are simply clear, written explanations of your view on a company that connect the story you believe about its future to the numbers you are using for revenue growth, margins, and fair value. On Simply Wall St, Narratives sit inside the Community page and act as an easy, guided tool that helps you turn your expectations for Eos Energy Enterprises into a concrete forecast and a fair value estimate that you can directly compare with today’s share price to decide whether it looks like a buy, hold, or sell. Because Narratives on the platform are updated dynamically as new news, earnings, and guidance are released, your view can evolve with the facts rather than staying locked in outdated assumptions. For example, one Eos Narrative might assume rapid scaling, strong margins, and arrive at a fair value around $16.40 per share, while a more cautious Narrative could lean on slower growth, thinner margins, and a fair value nearer $5.00. This shows how different perspectives can reasonably coexist around the same stock.
Do you think there's more to the story for Eos Energy Enterprises? Head over to our Community to see what others are saying!
This article by Simply Wall St is general in nature. We provide commentary based on historical data and analyst forecasts only using an unbiased methodology and our articles are not intended to be financial advice. It does not constitute a recommendation to buy or sell any stock, and does not take account of your objectives, or your financial situation. We aim to bring you long-term focused analysis driven by fundamental data. Note that our analysis may not factor in the latest price-sensitive company announcements or qualitative material. Simply Wall St has no position in any stocks mentioned.
Have feedback on this article? Concerned about the content? Get in touch with us directly. Alternatively, email editorial-team@simplywallst.com