
- PREMIUM
- LIVE QUOTES
- INSTITUTION
 Index Options
 State Street
 CME Group
 Nasdaq
 Cboe
Cboe TradingView
 Wall Street Journal
Is Southwest Airlines Stock Rally Justified Amid High Valuation Metrics in 2025?
- If you are wondering whether Southwest Airlines at around $37.85 is a bargain or a value trap, you are in the right place to unpack what the current price is really telling us.
- The stock has climbed 8.7% over the last week, 19.7% over the past month, and is up around 13.4% year to date, signaling that sentiment has improved even after a choppy few years that still leave 5 year returns at about -11.7%.
- Recent headlines have focused on Southwest's ongoing efforts to restore operational reliability after prior disruption issues and its strategy for managing capacity and route choices in a more competitive domestic market. At the same time, industry wide themes like fuel cost volatility, labor negotiations, and Boeing delivery constraints have shaped how investors assess Southwest's ability to defend its low cost advantage.
- Despite that backdrop, Southwest currently scores just 0/6 on our valuation checks, so we will walk through why classic metrics like discounted cash flow and multiples might still be missing part of the story, and then finish with a more holistic way to think about the stock's true value.
Southwest Airlines scores just 0/6 on our valuation checks. See what other red flags we found in the full valuation breakdown.
Approach 1: Southwest Airlines Dividend Discount Model (DDM) Analysis
The Dividend Discount Model estimates what a stock is worth today by projecting all future dividend payments and discounting them back to a present value. It is most useful for mature companies with stable, predictable dividends.
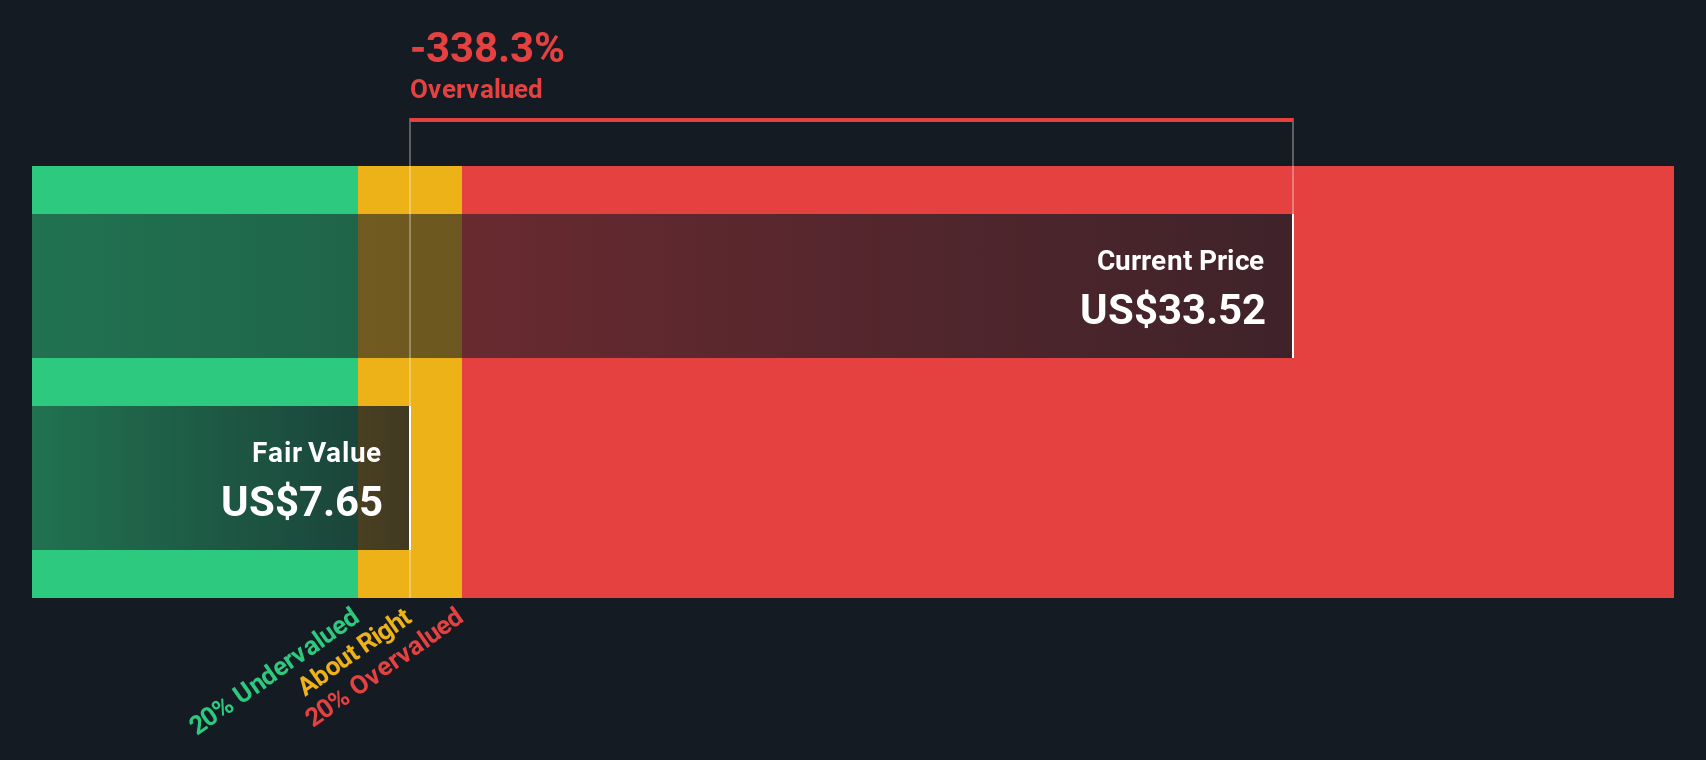
For Southwest Airlines, the model starts with an annual dividend per share of about $0.78 and an estimated return on equity of roughly 4.5%. With a payout ratio above 92%, only a small portion of earnings is being retained to fuel growth. This translates into a very modest implied dividend growth rate of around 0.35% a year, based on the formula using retained earnings and ROE.
Plugging these inputs into the DDM framework yields an estimated intrinsic value of about $8.06 per share. Compared with the recent share price near $37.85, the model suggests the stock is roughly 369.7% overvalued. This implies that investors are paying a substantial premium over what the current dividend stream can justify on conservative assumptions.
Result: OVERVALUED
Our Dividend Discount Model (DDM) analysis suggests Southwest Airlines may be overvalued by 369.7%. Discover 906 undervalued stocks or create your own screener to find better value opportunities.
Approach 2: Southwest Airlines Price vs Earnings
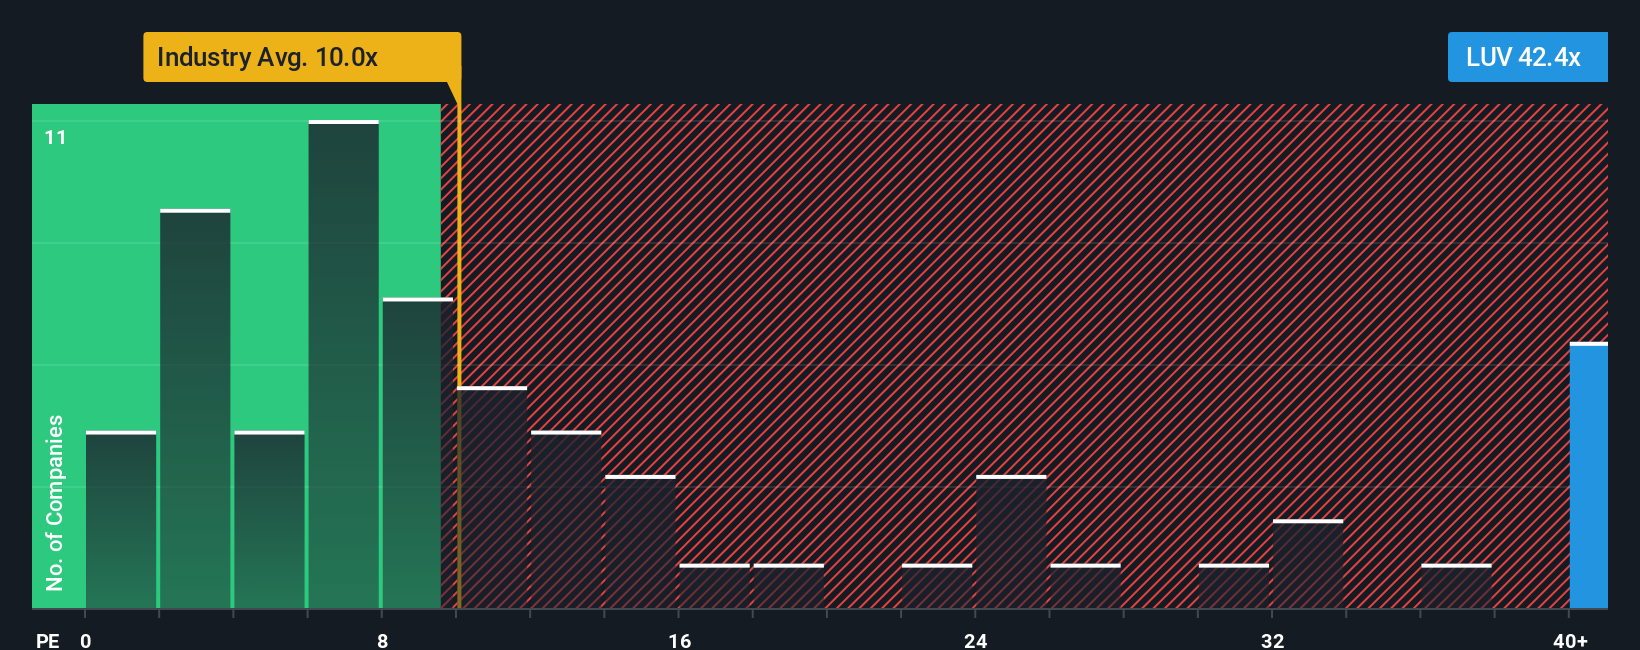
For consistently profitable companies, the price to earnings ratio is often the most intuitive yardstick because it links what investors pay today to the profits the business is generating each year. In general, higher expected earnings growth and lower perceived risk can justify a higher PE multiple, while slower growth and greater uncertainty usually warrant a lower one.
Southwest currently trades on a PE of about 51.6x, which sits well above the broader airlines industry average of roughly 9.1x and also above the peer group average near 10.8x. Simply Wall St also calculates a proprietary Fair Ratio of around 28.8x for Southwest, which reflects what a reasonable PE might be given its specific earnings growth outlook, industry, margins, size, and risk profile.
This Fair Ratio is more tailored than a simple peer or industry comparison because it adjusts for Southwest’s own fundamentals rather than assuming it should look like the average airline. When we compare the Fair Ratio of 28.8x with the current PE of 51.6x, the shares appear meaningfully overvalued on this earnings based lens.
Result: OVERVALUED
PE ratios tell one story, but what if the real opportunity lies elsewhere? Discover 1442 companies where insiders are betting big on explosive growth.
Upgrade Your Decision Making: Choose your Southwest Airlines Narrative
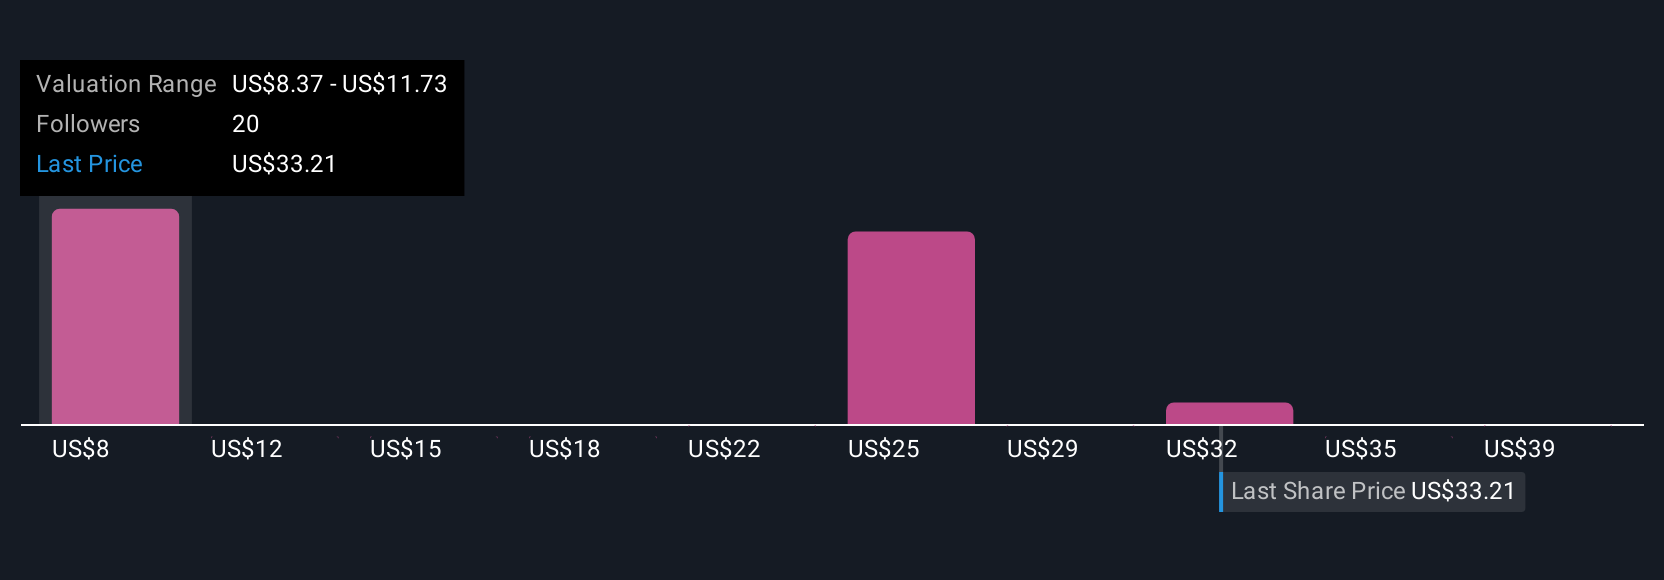
Earlier we mentioned that there is an even better way to understand valuation, so let us introduce you to Narratives, an easy tool on Simply Wall St’s Community page where millions of investors connect a company’s story with a financial forecast and a fair value. By writing their own view of Southwest’s future revenue, earnings and margins, then comparing that Fair Value to today’s Price to decide whether to buy or sell, each Narrative updates automatically as new news or earnings arrive. For example, a bullish investor might see Southwest’s distribution expansion, new seating products and cost efficiencies supporting a fair value closer to the high analyst target of about $46. A more cautious investor, focused on macro risks, Boeing delivery issues and competitive pressure, might anchor their Narrative nearer the low target around $19. Both perspectives can sit side by side on the platform, giving you a simple, story driven lens to judge where your own assumptions fit on that spectrum.
Do you think there's more to the story for Southwest Airlines? Head over to our Community to see what others are saying!
This article by Simply Wall St is general in nature. We provide commentary based on historical data and analyst forecasts only using an unbiased methodology and our articles are not intended to be financial advice. It does not constitute a recommendation to buy or sell any stock, and does not take account of your objectives, or your financial situation. We aim to bring you long-term focused analysis driven by fundamental data. Note that our analysis may not factor in the latest price-sensitive company announcements or qualitative material. Simply Wall St has no position in any stocks mentioned.
Have feedback on this article? Concerned about the content? Get in touch with us directly. Alternatively, email editorial-team@simplywallst.com