
- PREMIUM
- LIVE QUOTES
- INSTITUTION
 Index Options
 State Street
 CME Group
 Nasdaq
 Cboe
Cboe TradingView
 Wall Street Journal
Has Caterpillar’s 68% 2025 Surge Already Priced In Its Growth Story?
- If you are wondering whether Caterpillar is still attractive after its huge run, or if you are turning up late to the party, this breakdown will walk through what the current price is really baking in.
- The stock has climbed 4.8% over the last week, 6.0% in the last month, and is up an eye catching 67.7% year to date, adding to a 55.0% gain over the past year and a 270.0% gain over five years.
- Those gains have been underpinned by ongoing optimism around U.S. infrastructure spending and global construction activity, as well as Caterpillar's push into higher margin services and technology enabled equipment. Investors have also been reacting to commentary about stronger demand in key end markets and expectations that large scale industrial investment cycles could have more room to run.
- Despite that backdrop, Caterpillar only scores 1 out of 6 on our valuation checks. This suggests most traditional metrics view the stock as fully priced or even stretched. The rest of this article will unpack those methods while hinting at a more nuanced way to think about valuation that we will come back to at the end.
Caterpillar scores just 1/6 on our valuation checks. See what other red flags we found in the full valuation breakdown.
Approach 1: Caterpillar Discounted Cash Flow (DCF) Analysis
A Discounted Cash Flow model estimates what a company is worth by projecting its future cash flows and then discounting them back to today, to reflect the time value of money and investment risk.
For Caterpillar, the latest twelve month Free Cash Flow is about $8.3 billion. Analysts have provided detailed forecasts for the next few years. Beyond that, Simply Wall St extrapolates the trend, resulting in projected Free Cash Flow of roughly $19.1 billion by 2034. These projections are based on a 2 Stage Free Cash Flow to Equity approach that starts with higher near term growth before tapering to more mature levels over time.
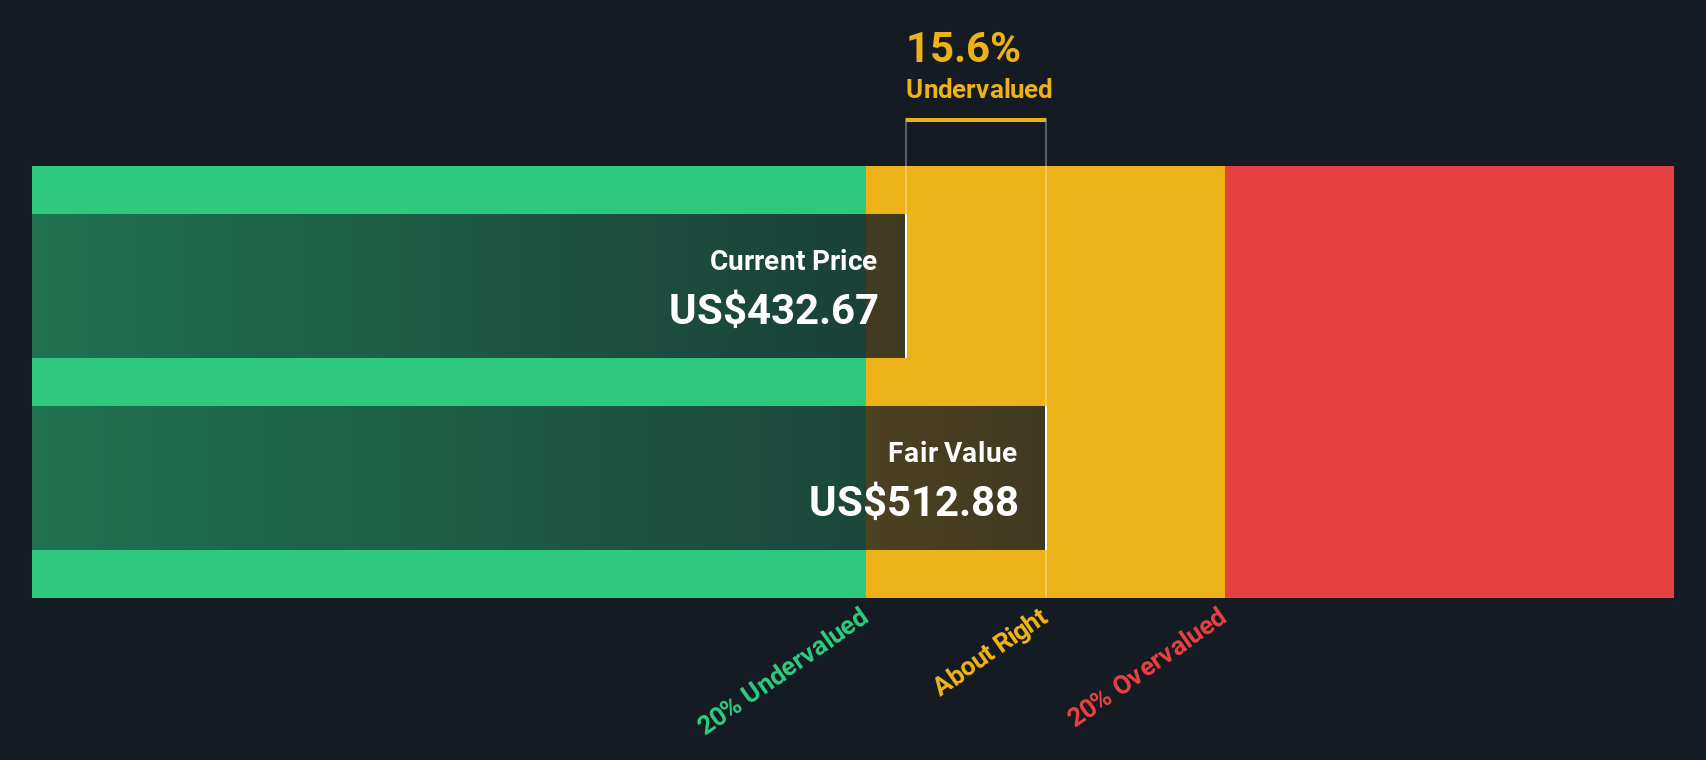
When all those future cash flows are discounted back, the model arrives at an estimated intrinsic value of about $554.56 per share. With the DCF suggesting the shares are roughly 8.8% above their fair value, Caterpillar screens as only slightly overvalued on this cash flow basis rather than wildly expensive.
Result: ABOUT RIGHT
Caterpillar is fairly valued according to our Discounted Cash Flow (DCF), but this can change at a moment's notice. Track the value in your watchlist or portfolio and be alerted on when to act.
Approach 2: Caterpillar Price vs Earnings
For profitable, mature businesses like Caterpillar, the Price to Earnings (PE) ratio is a useful shorthand for what investors are willing to pay today for a dollar of current earnings. It naturally links valuation to how fast those earnings are expected to grow and how risky or cyclical they might be.
In general, companies with faster, more reliable growth and lower risk tend to justify higher PE ratios, while slower growing or more volatile businesses usually deserve lower multiples. Caterpillar currently trades on about 30.44x earnings, which is above both the Machinery industry average of roughly 25.48x and the peer group average of around 22.56x. This suggests the market is already paying a premium for its prospects.
Simply Wall St's Fair Ratio framework estimates what a more tailored PE might be, given Caterpillar's specific earnings growth profile, margins, industry, size and risk characteristics. This Fair Ratio comes out at roughly 41.36x, which is higher than the current market multiple. Because it directly incorporates growth and risk rather than relying on broad peer or industry comparisons, it can provide a more nuanced yardstick. On that basis Caterpillar screens as undervalued relative to its Fair Ratio.
Result: UNDERVALUED

PE ratios tell one story, but what if the real opportunity lies elsewhere? Discover 1442 companies where insiders are betting big on explosive growth.
Upgrade Your Decision Making: Choose your Caterpillar Narrative
Earlier we mentioned that there is an even better way to understand valuation. Let us introduce you to Narratives, which are simple stories that connect your view of a company to specific forecasts for its future revenue, earnings and margins, and then translate that story into a fair value you can compare to today’s share price.
On Simply Wall St, Narratives live in the Community page and are designed to be accessible. You can quickly see how a company’s story, the numbers behind that story, and the resulting fair value all line up to help you decide whether to buy, hold or sell.
Because Narratives are refreshed as new information comes in, such as quarterly earnings, major news or changes in analyst expectations, they stay current and can update your fair value view without requiring you to rebuild your entire model from scratch.
For Caterpillar, for example, one Narrative might assume strong infrastructure and data center demand with improving margins and support a fair value of about $588 per share. A more cautious Narrative that focuses on tariff headwinds and margin pressure might point to a fair value nearer $350, highlighting how different perspectives on the same business can lead to very different investment conclusions.
Do you think there's more to the story for Caterpillar? Head over to our Community to see what others are saying!
This article by Simply Wall St is general in nature. We provide commentary based on historical data and analyst forecasts only using an unbiased methodology and our articles are not intended to be financial advice. It does not constitute a recommendation to buy or sell any stock, and does not take account of your objectives, or your financial situation. We aim to bring you long-term focused analysis driven by fundamental data. Note that our analysis may not factor in the latest price-sensitive company announcements or qualitative material. Simply Wall St has no position in any stocks mentioned.
Have feedback on this article? Concerned about the content? Get in touch with us directly. Alternatively, email editorial-team@simplywallst.com