
- PREMIUM
- LIVE QUOTES
- INSTITUTION
 Index Options
 State Street
 CME Group
 Nasdaq
 Cboe
Cboe TradingView
 Wall Street Journal
Has New Gold’s 182% Surge in 2024 Run Ahead of Its Fundamentals?
- Wondering if New Gold is still a smart buy after its huge run, or if you have already missed the boat? This breakdown will help you decide whether the current price still stacks up against its fundamentals.
- The stock has been on a wild ride, up 181.7% year to date and 167.6% over the last year, even after a recent 6.7% pullback in the past week and an 11.1% gain over the last month.
- That surge has come as investors have piled into gold and copper names, with New Gold riding the wave of stronger commodity prices and growing interest in miners with leveraged exposure to metals. At the same time, the market has been reassessing risk across the sector amid shifting rate expectations and renewed focus on asset quality and mine life.
- Even with all that excitement, New Gold only scores a 2 out of 6 on our valuation checks. We will dig into what traditional multiples, cash flow based models, and a more holistic framework say about whether the market is now overreaching or still underestimating the story.
New Gold scores just 2/6 on our valuation checks. See what other red flags we found in the full valuation breakdown.
Approach 1: New Gold Discounted Cash Flow (DCF) Analysis
A Discounted Cash Flow model estimates what a company is worth by projecting the cash it can generate in the future and discounting those cash flows back to today. For New Gold, the model used is a 2 stage Free Cash Flow to Equity approach, based on cash flow projections rather than earnings.
New Gold generated about $188.5 Million in free cash flow over the last twelve months, and analysts plus extrapolated estimates see this rising to roughly $1.05 Billion in free cash flow by 2035. The biggest step up in the near term is a projected $1.18 Billion in 2028, after which growth moderates as the company matures and production assumptions normalize.
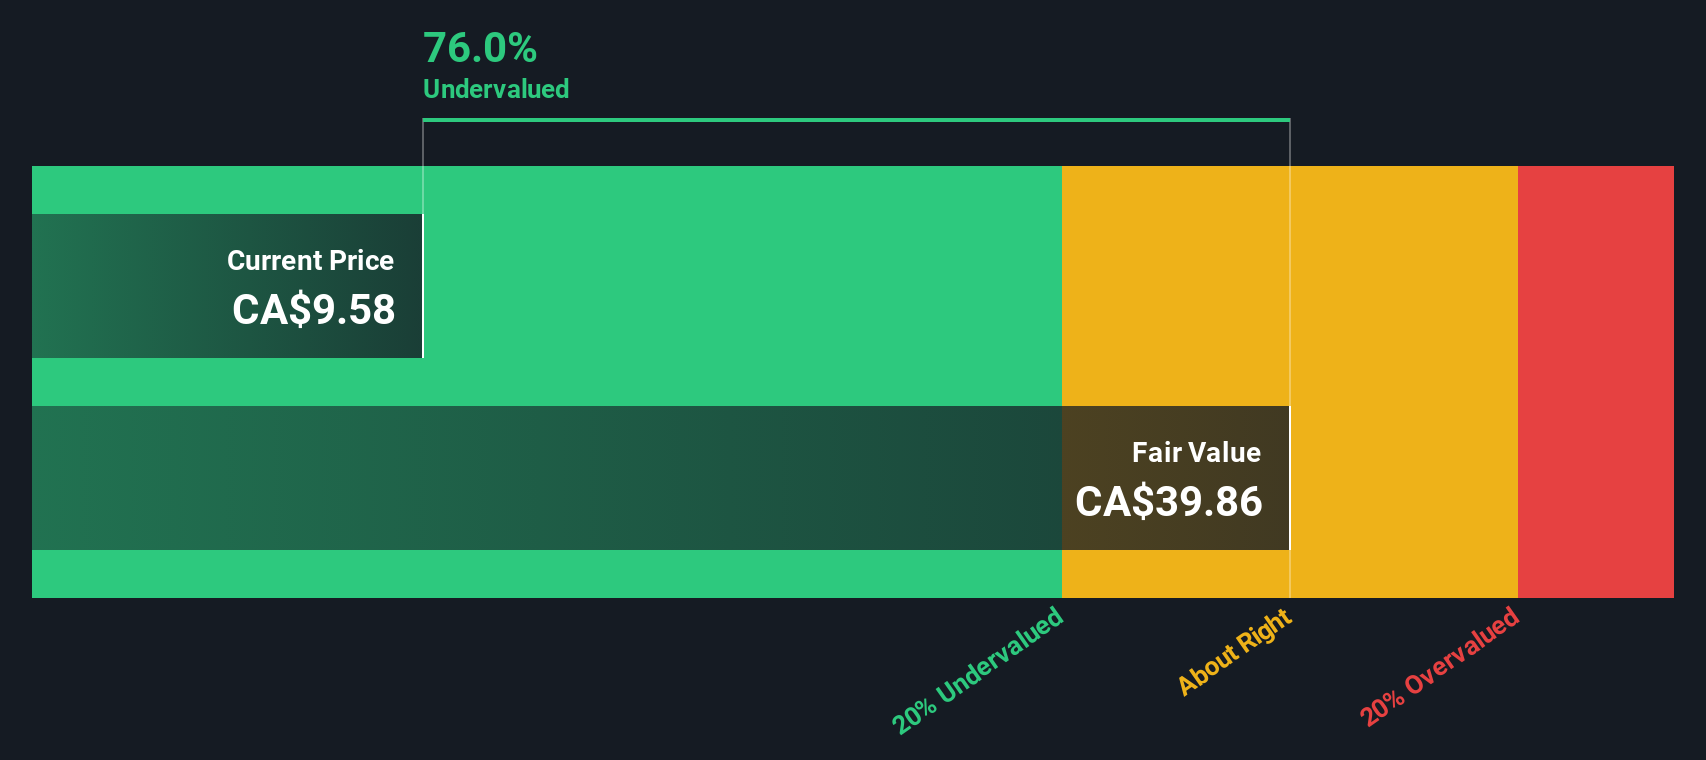
When all those projected cash flows are discounted back to today, Simply Wall St estimates an intrinsic value of about $35.03 per share. That implies the stock is trading at roughly a 69.6% discount to its DCF value, suggesting the market is still pricing in a lot of risk relative to the modeled cash flow potential.
Result: UNDERVALUED
Our Discounted Cash Flow (DCF) analysis suggests New Gold is undervalued by 69.6%. Track this in your watchlist or portfolio, or discover 906 more undervalued stocks based on cash flows.
Approach 2: New Gold Price vs Earnings
For profitable companies like New Gold, the Price to Earnings (PE) ratio is a useful shorthand for how much investors are willing to pay today for each dollar of current earnings. It naturally captures the market’s view on growth and risk, since faster growing, lower risk businesses usually justify a higher PE, while slower or riskier names tend to trade on lower multiples.
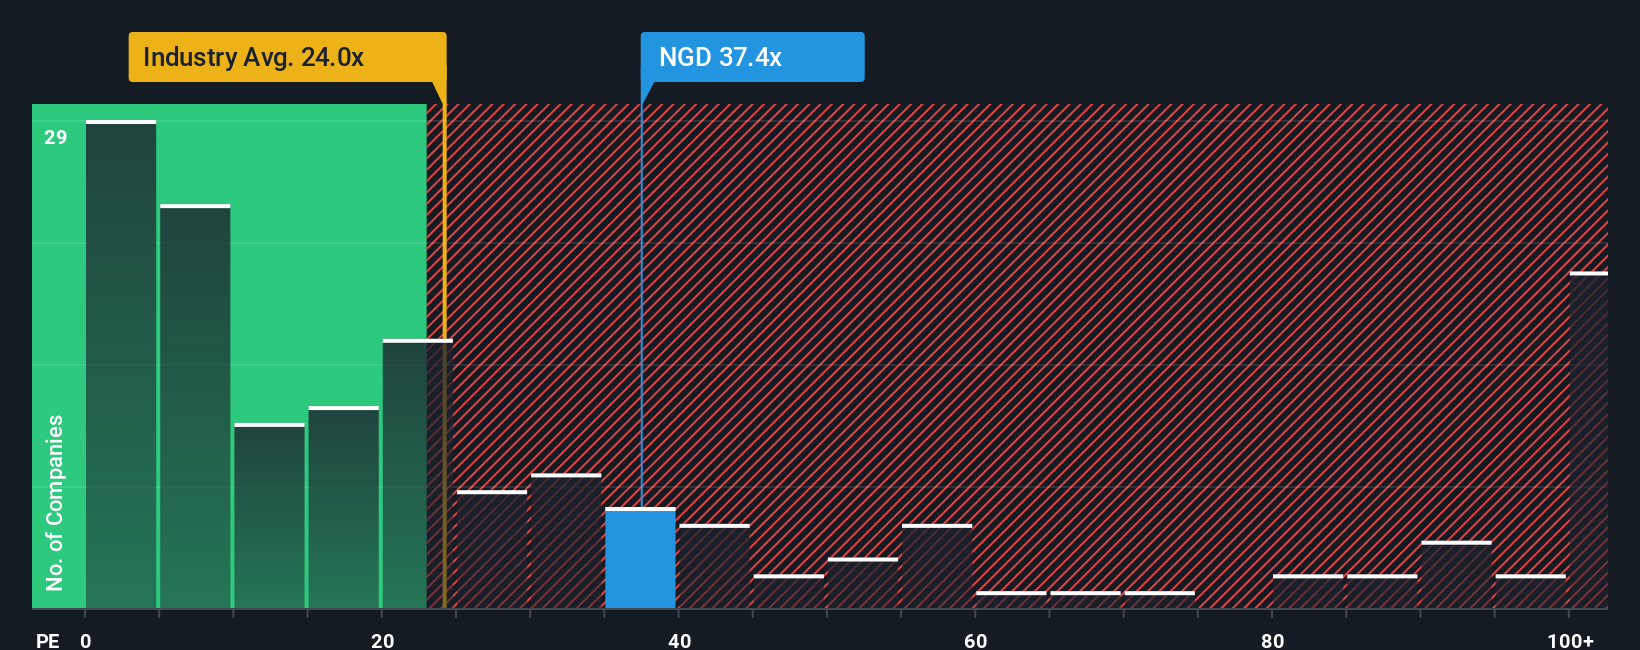
New Gold currently trades on a PE of about 24.5x, which is slightly above both the Metals and Mining industry average of around 21.2x and the peer group at roughly 24.0x. On the surface, that premium suggests investors are already baking in a reasonably strong outlook. However, raw comparisons like this miss important nuances such as New Gold’s specific growth profile, margins, balance sheet and size.
This is where Simply Wall St’s Fair Ratio comes in. It is a proprietary estimate of what New Gold’s PE should be, given its earnings growth, industry, profit margins, market cap and risk factors. In this case, the Fair Ratio is 23.6x, only a touch below the current 24.5x, implying the stock is trading close to where you might reasonably expect based on its fundamentals.
Result: ABOUT RIGHT
PE ratios tell one story, but what if the real opportunity lies elsewhere? Discover 1442 companies where insiders are betting big on explosive growth.
Upgrade Your Decision Making: Choose your New Gold Narrative
Earlier we mentioned that there is an even better way to understand valuation, so let us introduce you to Narratives, which are simple, story driven explanations of what you think will happen to a company’s revenue, earnings and margins, linked directly to a financial forecast and an estimated fair value. Instead of only looking at static multiples, a Narrative lets you spell out your view on New Gold’s assets, growth drivers, risks and commodity prices, then see how that story translates into future cash flows and what you believe the shares are truly worth. Narratives are easy to use and live inside the Community section of Simply Wall St, where millions of investors share and compare their views. They also help you decide when to buy or sell, by continuously comparing each Narrative’s Fair Value to the current share price and updating automatically as new earnings, news and guidance arrive. For example, one New Gold Narrative might assume gold at $4,500 with rapid production gains and justify a much higher fair value, while a more cautious Narrative might focus on high costs, asset maturity and capex risk to conclude that today’s price already reflects most of the upside.
Do you think there's more to the story for New Gold? Head over to our Community to see what others are saying!
This article by Simply Wall St is general in nature. We provide commentary based on historical data and analyst forecasts only using an unbiased methodology and our articles are not intended to be financial advice. It does not constitute a recommendation to buy or sell any stock, and does not take account of your objectives, or your financial situation. We aim to bring you long-term focused analysis driven by fundamental data. Note that our analysis may not factor in the latest price-sensitive company announcements or qualitative material. Simply Wall St has no position in any stocks mentioned.
Have feedback on this article? Concerned about the content? Get in touch with us directly. Alternatively, email editorial-team@simplywallst.com