
- PREMIUM
- LIVE QUOTES
- INSTITUTION
 Index Options
 State Street
 CME Group
 Nasdaq
 Cboe
Cboe TradingView
 Wall Street Journal
Is Now the Moment to Reassess Okta at $85 After Recent Share Price Rebound?
- Wondering if Okta at around $85.89 is a quiet bargain or a value trap? This breakdown will help you decide whether the current price really stacks up against its fundamentals.
- Despite a choppy ride, Okta is up 6.9% over the last week and 9.0% year to date, even though the stock is still down 66.0% over five years. That combination suggests sentiment has shifted, but long-term scars remain.
- Recently, Okta has stayed in the spotlight as identity security remains mission critical for enterprises and the company continues rolling out new integrations and platform enhancements that deepen customer lock in. At the same time, ongoing macro uncertainty and renewed focus on profitable growth across software have kept investors closely focused on whether Okta can justify a premium multiple in a more selective market.
- Right now Okta only scores 2 out of 6 on our valuation checks, suggesting it screens as undervalued on just a couple of metrics. We will walk through DCF, multiples, and other approaches, then finish by looking at a more holistic way to think about what Okta is really worth.
Okta scores just 2/6 on our valuation checks. See what other red flags we found in the full valuation breakdown.
Approach 1: Okta Discounted Cash Flow (DCF) Analysis
A Discounted Cash Flow model estimates what a company is worth by projecting the cash it can generate in the future, then discounting those cash flows back to today in dollar terms.
For Okta, the latest twelve month Free Cash Flow sits at around $888.3 million. Analysts and internal estimates see this rising steadily, with Simply Wall St using a 2 Stage Free Cash Flow to Equity model. On their projections, Okta’s Free Cash Flow could reach roughly $1.27 billion by 2030, with analyst forecasts covering the nearer years and later years extrapolated from those trends.
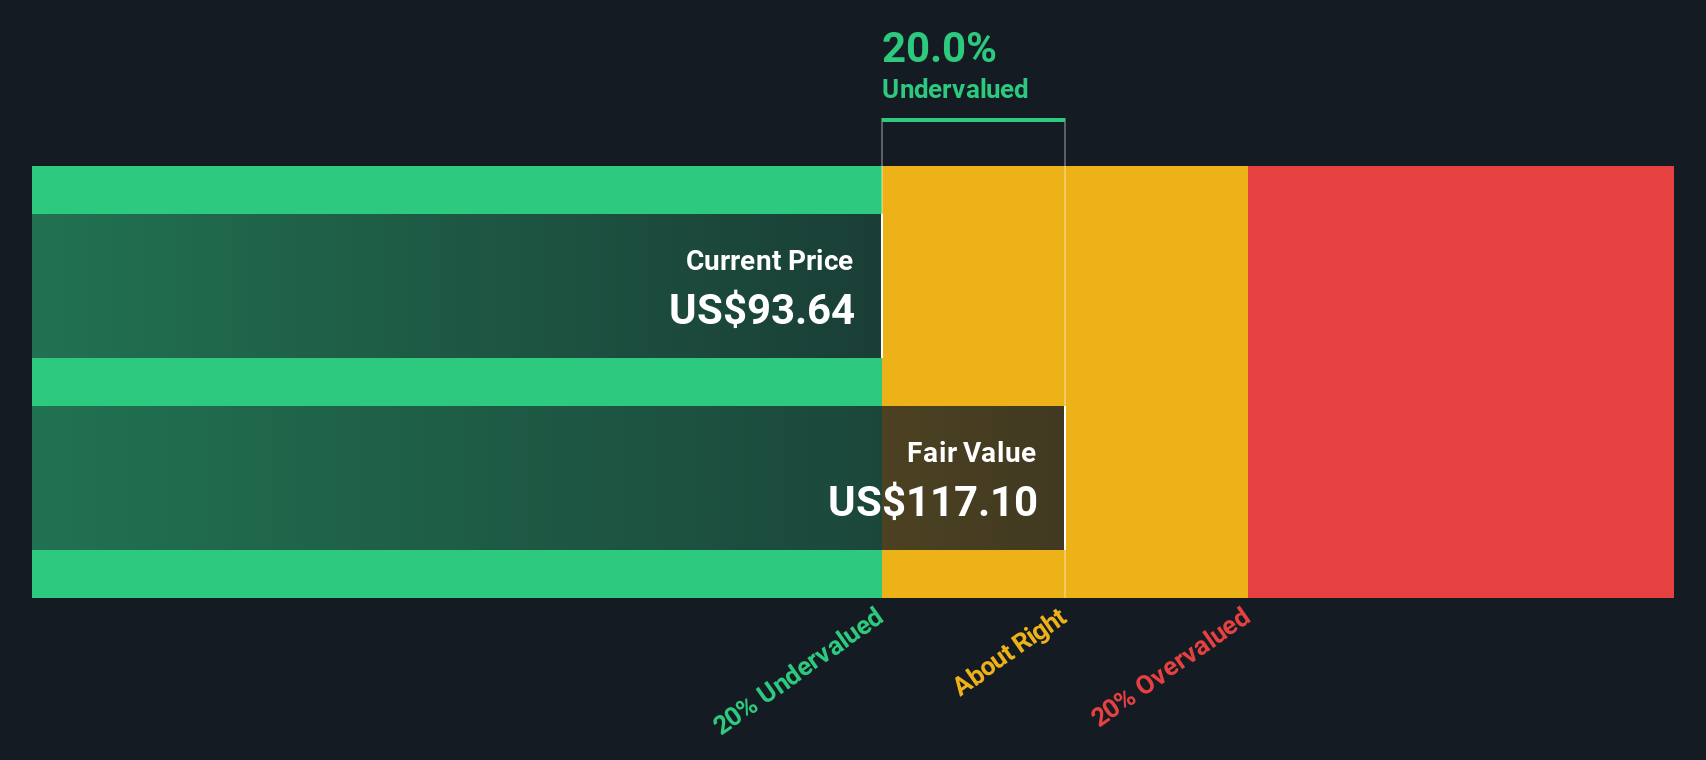
When these projected cash flows are discounted back to the present, the model arrives at an intrinsic value of about $116.82 per share. Compared with the recent share price of roughly $85.89, the DCF suggests Okta is trading at a 26.5% discount to its estimated fair value, indicating potential upside if the cash flow trajectory develops as modeled.
Result: UNDERVALUED
Our Discounted Cash Flow (DCF) analysis suggests Okta is undervalued by 26.5%. Track this in your watchlist or portfolio, or discover 906 more undervalued stocks based on cash flows.
Approach 2: Okta Price vs Earnings
For profitable companies like Okta, the Price to Earnings (PE) ratio is a useful yardstick because it links what investors pay today to the profits the business is actually generating. In general, faster growth and lower perceived risk justify a higher PE, while slower or more uncertain growth should translate to a lower, more conservative multiple.
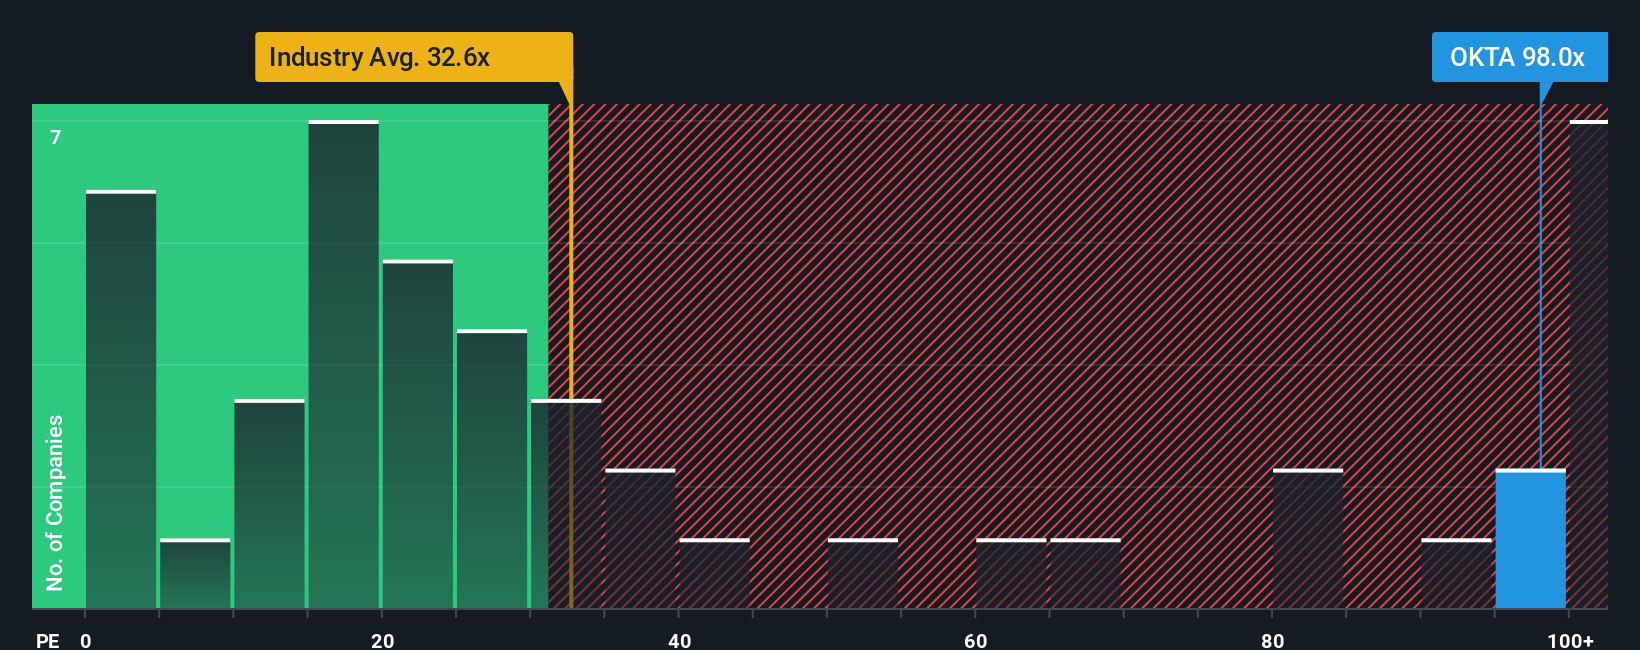
Okta currently trades on a PE of about 78.1x, which is well above the broader IT industry average of roughly 30.3x and also richer than the peer group average around 29.0x. On those simple comparisons alone, the stock screens as expensive. However, Simply Wall St goes a step further with its proprietary Fair Ratio, which in Okta’s case comes out at about 36.2x. This Fair Ratio reflects Okta’s specific earnings growth outlook, risk profile, margins, industry, and market cap, making it more tailored than blunt peer or sector averages.
Because Okta’s actual PE of 78.1x sits meaningfully above the 36.2x Fair Ratio, the multiple based view suggests the market is paying a hefty premium over what those fundamentals would typically support.
Result: OVERVALUED
PE ratios tell one story, but what if the real opportunity lies elsewhere? Discover 1442 companies where insiders are betting big on explosive growth.
Upgrade Your Decision Making: Choose your Okta Narrative
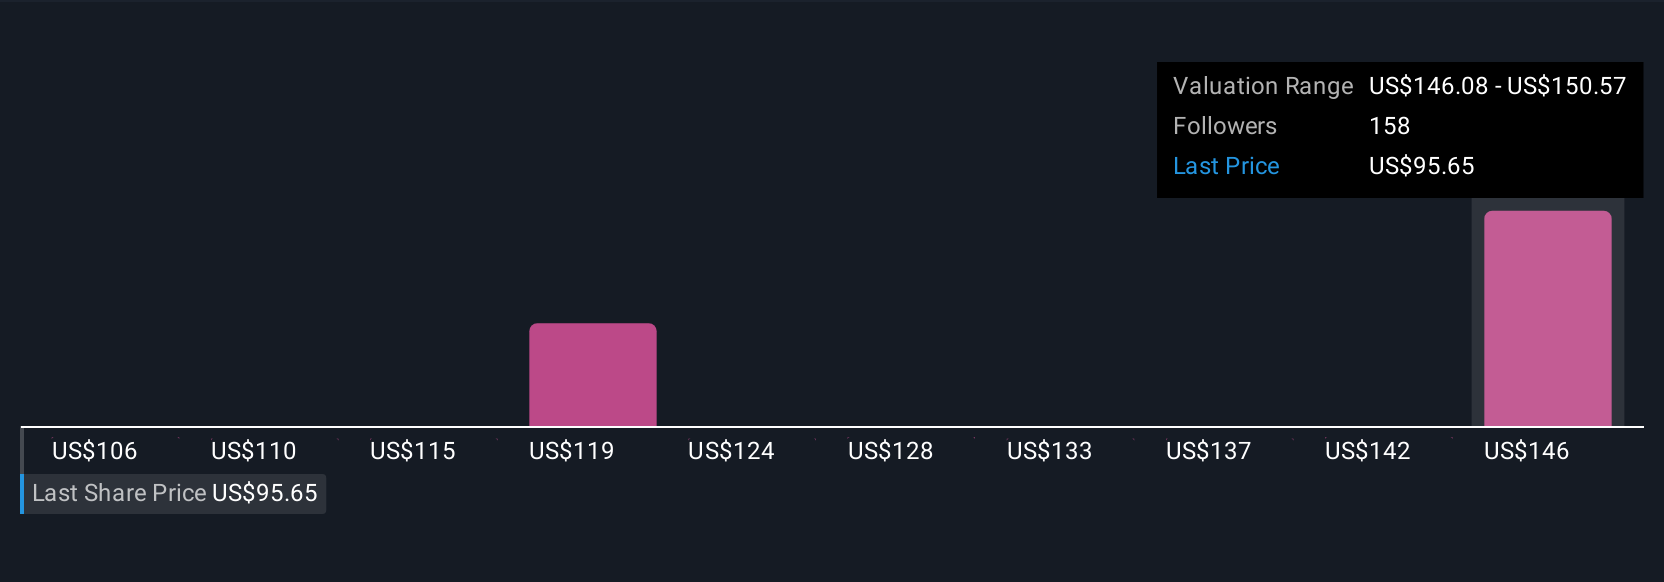
Earlier we mentioned that there is an even better way to understand valuation, so let us introduce you to Narratives, a simple framework that connects your view of a company’s story with a concrete financial forecast and a fair value estimate. A Narrative on Simply Wall St is your version of Okta’s future, where you spell out how you think revenue, earnings and margins will evolve, and the platform turns that story into numbers and an estimated fair value that you can compare directly with today’s share price to help you consider whether to buy, hold, or sell. These Narratives live in the Community page used by millions of investors, are easy to create or adapt, and automatically update as new information like earnings results or major news flows through the system. For example, one Okta Narrative on Simply Wall St currently sees fair value near $148 per share while another puts it closer to $119, reflecting very different views on profitability, growth and risk. Both provide a clear, dynamic link between an investor’s story and the price they are willing to pay.
Do you think there's more to the story for Okta? Head over to our Community to see what others are saying!
This article by Simply Wall St is general in nature. We provide commentary based on historical data and analyst forecasts only using an unbiased methodology and our articles are not intended to be financial advice. It does not constitute a recommendation to buy or sell any stock, and does not take account of your objectives, or your financial situation. We aim to bring you long-term focused analysis driven by fundamental data. Note that our analysis may not factor in the latest price-sensitive company announcements or qualitative material. Simply Wall St has no position in any stocks mentioned.
Have feedback on this article? Concerned about the content? Get in touch with us directly. Alternatively, email editorial-team@simplywallst.com