
Has Ross Stores Rally Outrun Its Fundamentals After Strong Multi Year Share Gains?
- If you have been wondering whether Ross Stores is still a bargain at current levels, you are not alone. This stock has quietly become a favorite hunting ground for value curious investors.
- The share price closed around $177.87 recently, and with gains of 0.9% over the last week, 9.6% over the last month, and 16.6% year to date on top of multi year returns of 59.6% over 3 years and 66.3% over 5 years, the market clearly sees something to like even as the risk profile evolves.
- Recent headlines have focused on Ross Stores continued expansion of its off price footprint and its ability to draw in budget conscious shoppers as inflation reshapes consumer behavior. At the same time, analysts have highlighted the company as a defensive retail play, pointing to steady demand for discounted apparel and home goods even as discretionary spending wobbles.
- Despite that backdrop, our Simply Wall St valuation checks suggest Ross Stores currently scores just 0/6 on value, which might surprise investors given its track record. In the rest of this article, we will walk through traditional valuation approaches and then finish with a more holistic way to think about what the stock is really worth.
Ross Stores scores just 0/6 on our valuation checks. See what other red flags we found in the full valuation breakdown.
Approach 1: Ross Stores Discounted Cash Flow (DCF) Analysis
A Discounted Cash Flow model estimates what a business is worth today by projecting its future cash flows and discounting them back to the present. For Ross Stores, this uses a 2 stage Free Cash Flow to Equity approach, based on analyst forecasts and longer term extrapolations.
Ross generated last twelve month free cash flow of about $1.97 billion, and analysts expect this to rise steadily, with Simply Wall St projections reaching roughly $2.78 billion by 2030 and continuing to grow modestly thereafter. Each future cash flow is adjusted for risk and the time value of money to arrive at an estimated intrinsic value per share.
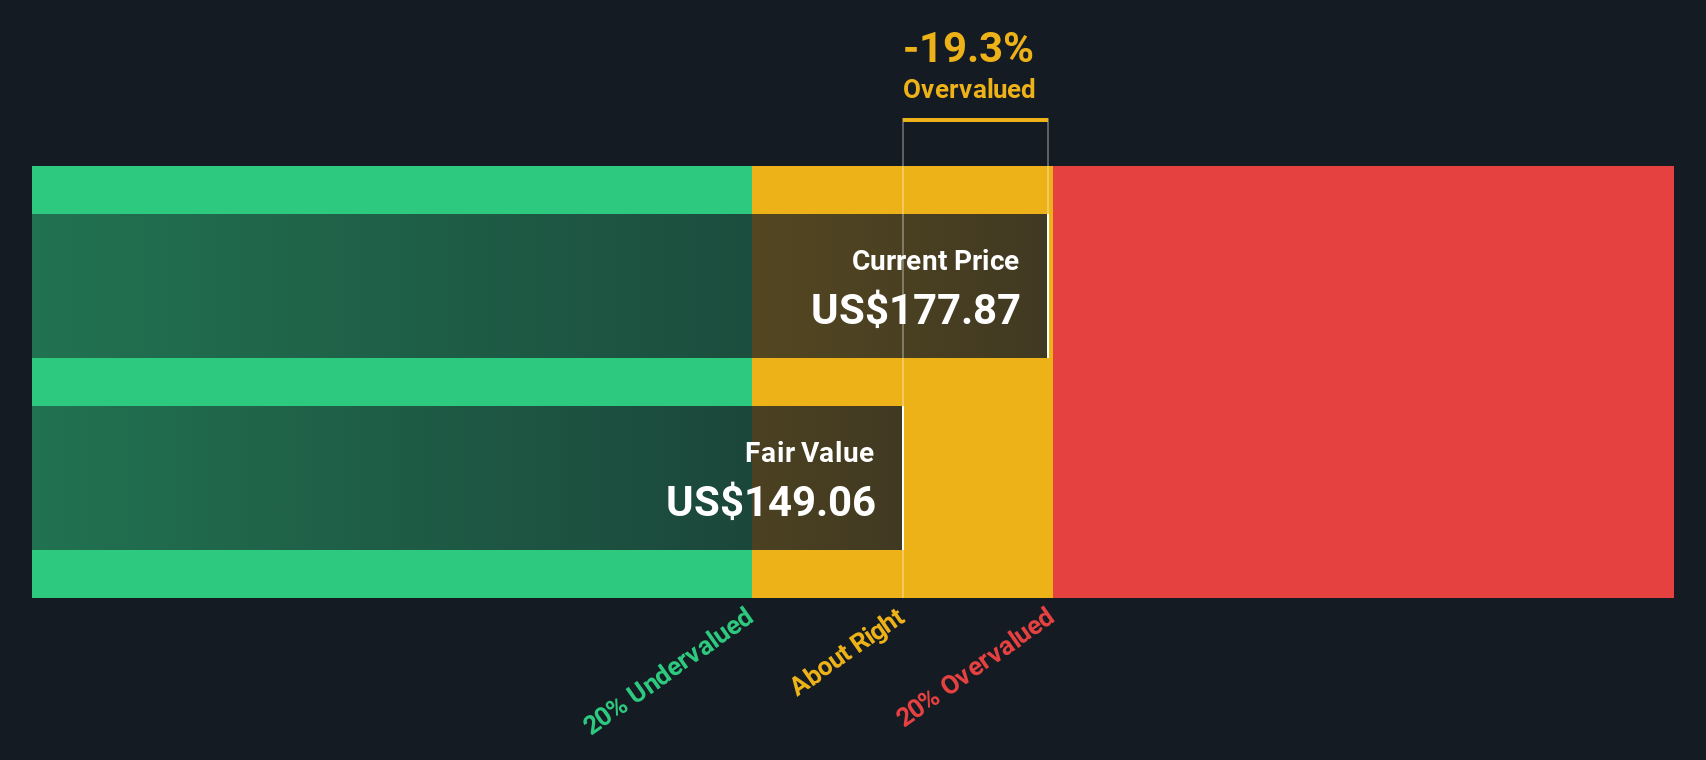
On this basis, the DCF model suggests a fair value of about $149 per share, compared with the recent market price around $178. That indicates Ross Stores is approximately 19.3% above this cash flow based estimate of fair value.
Result: OVERVALUED
Our Discounted Cash Flow (DCF) analysis suggests Ross Stores may be overvalued by 19.3%. Discover 906 undervalued stocks or create your own screener to find better value opportunities.
Approach 2: Ross Stores Price vs Earnings
For a mature, consistently profitable retailer like Ross Stores, the Price to Earnings ratio is a practical way to judge valuation because it ties the share price directly to current earnings power. Investors are typically willing to pay a higher PE when they expect stronger growth or perceive lower risk, and a lower PE when growth is slower or risks are higher.
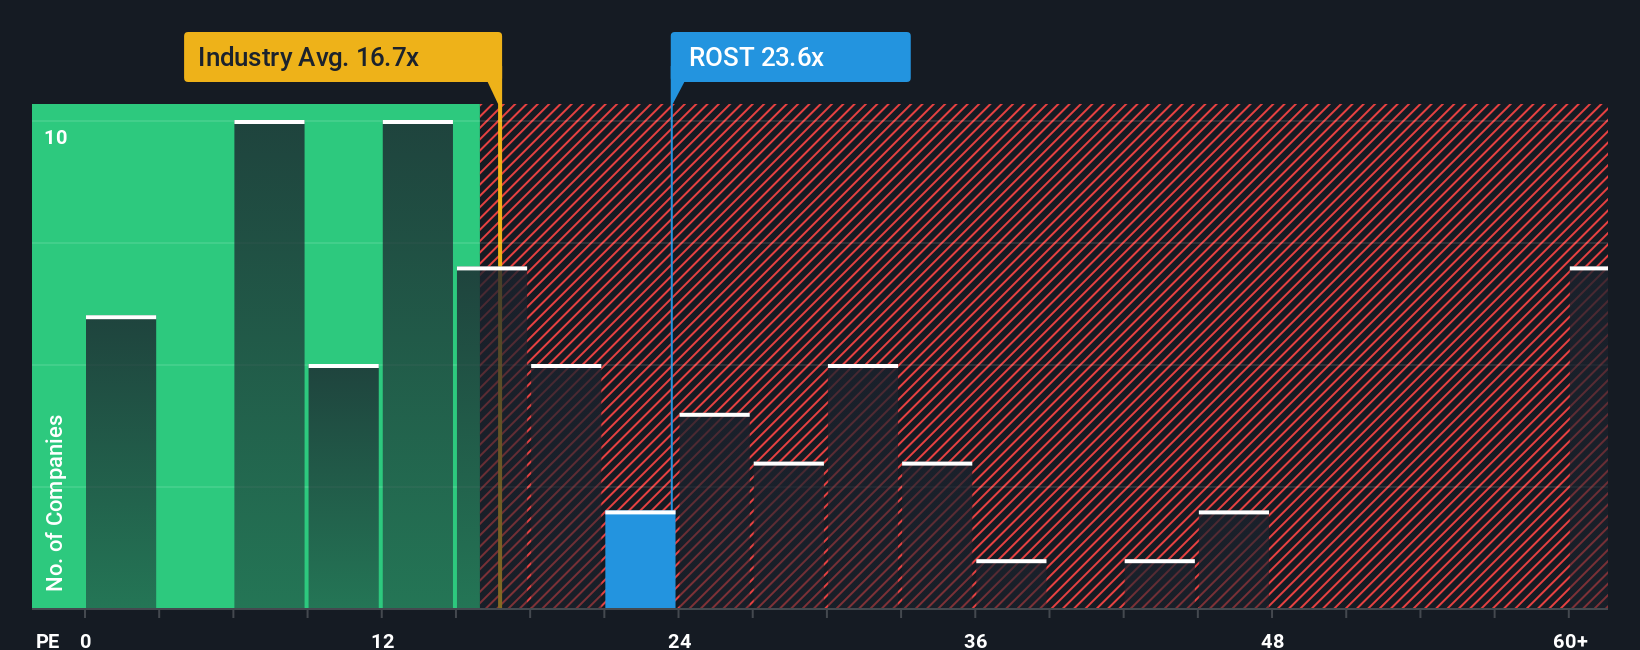
Ross Stores currently trades on a PE of about 27.7x, which is noticeably richer than both the Specialty Retail industry average of roughly 18.4x and the peer group average around 22.2x. On the surface, that premium suggests the market is paying up for Ross Stores scale, resilience and growth outlook.
Simply Wall St goes a step further by calculating a Fair Ratio, its proprietary estimate of what Ross Stores PE should be given its earnings growth profile, margins, industry, market cap and risk factors. For Ross Stores, that Fair Ratio comes out at about 19.4x, which is a more tailored benchmark than a simple industry or peer comparison. Since the current PE of 27.7x sits well above this Fair Ratio, the shares look expensive on an earnings multiple basis.
Result: OVERVALUED
PE ratios tell one story, but what if the real opportunity lies elsewhere? Discover 1442 companies where insiders are betting big on explosive growth.
Upgrade Your Decision Making: Choose your Ross Stores Narrative
Earlier we mentioned that there is an even better way to understand valuation, so let us introduce you to Narratives, a simple way to connect your view of Ross Stores story with a concrete financial forecast and a fair value that you can compare to today’s price. A Narrative on Simply Wall St is your own story behind the numbers, where you set assumptions for future revenue, earnings and margins, and the platform turns that into a forecast and fair value estimate that updates dynamically as new news, earnings and guidance arrive. This tool, available to millions of investors via the Community page, makes it easy to see when your fair value is above or below the current share price and therefore how Ross might fit into your own buy, hold or sell framework. For example, one investor might build a bullish Ross Narrative that assumes strong margin gains and a fair value closer to $200 per share, while another might take a more cautious view with slower growth and margin pressure, landing nearer $130. Narratives then lets you compare and refine these perspectives in one place.
Do you think there's more to the story for Ross Stores? Head over to our Community to see what others are saying!
This article by Simply Wall St is general in nature. We provide commentary based on historical data and analyst forecasts only using an unbiased methodology and our articles are not intended to be financial advice. It does not constitute a recommendation to buy or sell any stock, and does not take account of your objectives, or your financial situation. We aim to bring you long-term focused analysis driven by fundamental data. Note that our analysis may not factor in the latest price-sensitive company announcements or qualitative material. Simply Wall St has no position in any stocks mentioned.
Have feedback on this article? Concerned about the content? Get in touch with us directly. Alternatively, email editorial-team@simplywallst.com