
- PREMIUM
- LIVE QUOTES
- INSTITUTION
 Index Options
 State Street
 CME Group
 Nasdaq
 Cboe
Cboe TradingView
 Wall Street Journal
Has the Copper Rebound Made Ivanhoe Mines Too Pricey in 2025?
- Wondering if Ivanhoe Mines is a bargain after all the buzz, or if the market already sees what you are hoping to find? This breakdown is designed to cut through the noise and focus squarely on value.
- Despite being down 14.6% year to date and 24.4% over the last year, the stock has clawed back some ground with a 14.0% gain over the past month and a small 0.7% rise in the last week.
- Those swings have come as investors refocus on Ivanhoe's long term copper growth story and its portfolio of tier one projects, alongside speculation about how future supply deficits could support prices. At the same time, shifting sentiment toward metals tied to electrification and decarbonization has added extra volatility to anything copper related, including Ivanhoe Mines.
- On our framework, Ivanhoe scores just 1 out of 6 on undervaluation checks. The headline numbers do not point to deep value yet, but they also do not tell the full story. Next, we will unpack different valuation approaches to see what the market might be missing, then finish with a more nuanced way to think about Ivanhoe's true worth beyond the usual multiples and models.
Ivanhoe Mines scores just 1/6 on our valuation checks. See what other red flags we found in the full valuation breakdown.
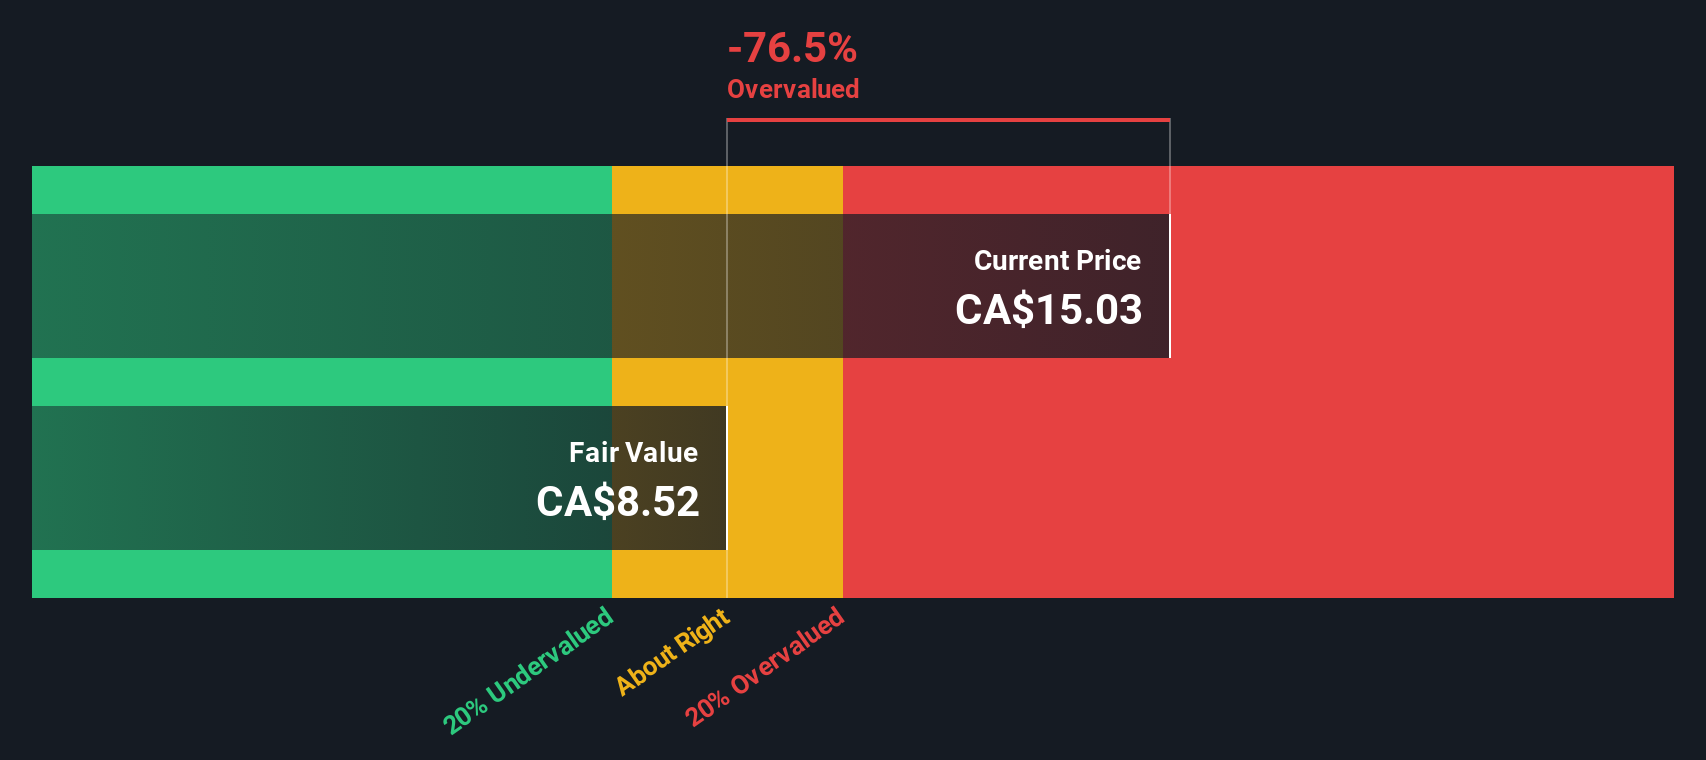
Approach 1: Ivanhoe Mines Discounted Cash Flow (DCF) Analysis
A Discounted Cash Flow model estimates what a business is worth today by projecting its future cash flows and then discounting those back to a present value. For Ivanhoe Mines, this 2 Stage Free Cash Flow to Equity approach uses recent cash generation as a starting point and then layers in analysts’ forecasts and longer term assumptions.
Right now, Ivanhoe is still burning cash, with last twelve month Free Cash Flow of roughly $1.46 billion in the red, reflecting heavy project build out. Analysts expect this to swing into positive territory over the next few years, with Free Cash Flow projected to reach about $759 million by 2035, based on a mix of explicit analyst estimates through 2029 and then more moderate growth assumptions thereafter, all measured in $.
When those cash flows are discounted back, the model produces an intrinsic value of about $11.57 per share. Based on the current market price, the model output suggests the stock is roughly 27.2% overvalued, indicating that investors may already be paying a premium for a very optimistic long term copper outlook.
Result: OVERVALUED
Our Discounted Cash Flow (DCF) analysis suggests Ivanhoe Mines may be overvalued by 27.2%. Discover 906 undervalued stocks or create your own screener to find better value opportunities.
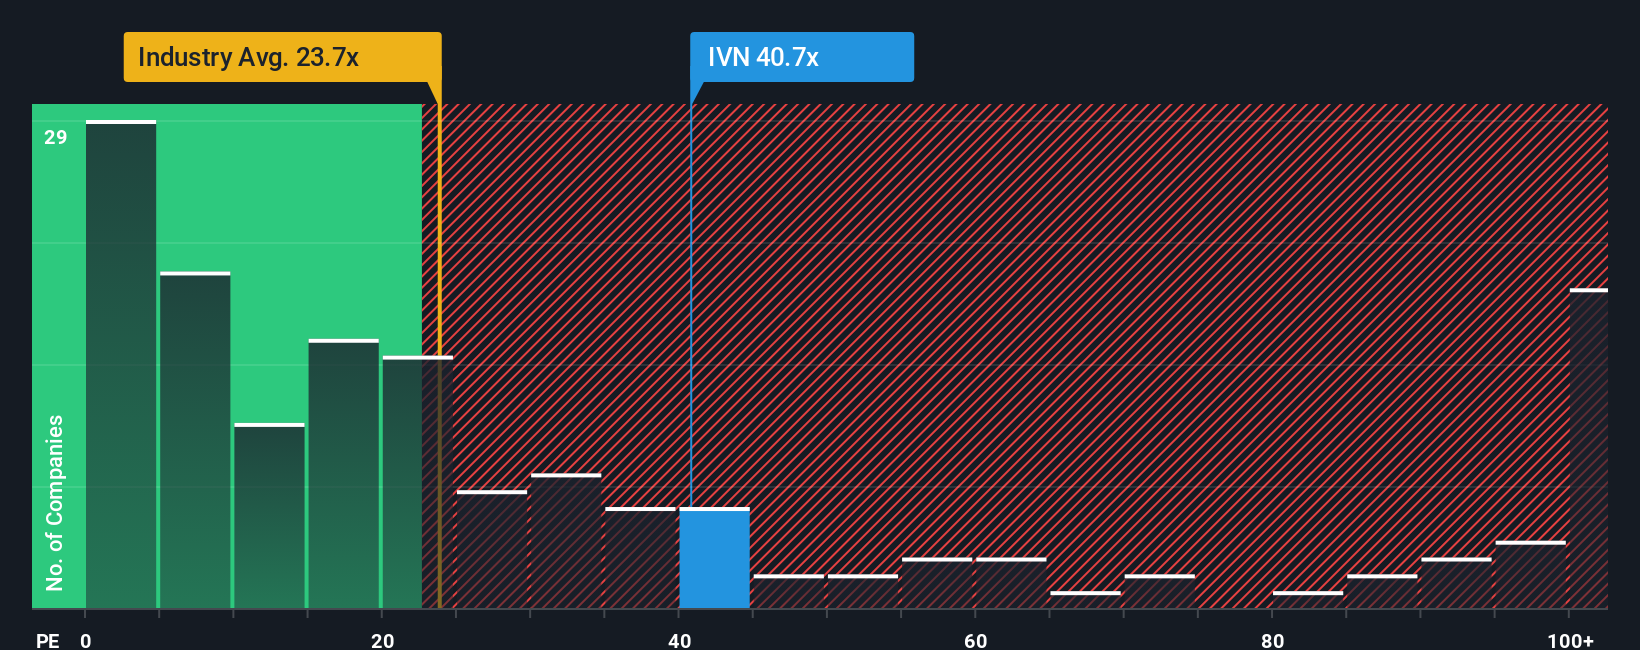
Approach 2: Ivanhoe Mines Price vs Earnings
For companies that are already generating earnings, the Price to Earnings, or PE, ratio is often the most intuitive valuation tool because it links what investors pay today to the profits the business is producing. In general, faster growth and lower risk justify a higher PE, while slower or more uncertain growth tends to cap what investors are willing to pay.
Ivanhoe Mines currently trades on a PE of about 49.45x, which is well above the Metals and Mining industry average of around 21.23x and also higher than the broader peer group, which on average trades at roughly 12.64x. To refine that comparison, Simply Wall St uses a Fair Ratio, here 27.67x, which estimates the PE Ivanhoe should trade on given its growth outlook, risk profile, margins, size and industry.
Because the Fair Ratio incorporates those company specific drivers, it offers a more tailored benchmark than simple industry or peer averages, which can be skewed by very different businesses. Lining the two up, Ivanhoe’s current 49.45x PE is materially above the 27.67x Fair Ratio, suggesting the shares look expensive once growth and risk are properly accounted for.
Result: OVERVALUED
PE ratios tell one story, but what if the real opportunity lies elsewhere? Discover 1442 companies where insiders are betting big on explosive growth.
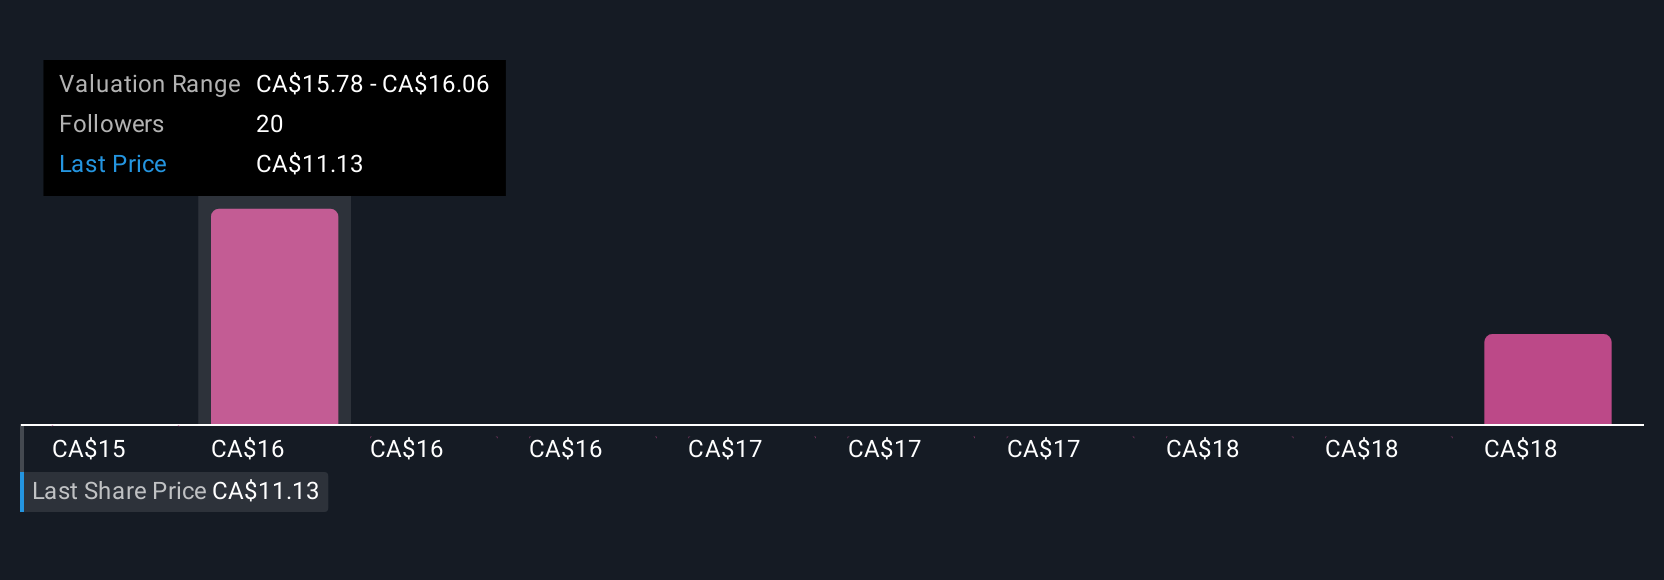
Upgrade Your Decision Making: Choose your Ivanhoe Mines Narrative
Earlier we mentioned that there is an even better way to understand valuation, so let us introduce you to Narratives, a simple way to connect your view of Ivanhoe Mines’ future (its growth drivers, risks and margins) to a financial forecast and then to a fair value that you can compare with today’s share price. On Simply Wall St’s Community page, Narratives let millions of investors express their story for a company by setting assumptions for revenue, earnings and profitability, which the platform then turns into projected cash flows, an estimated fair value and a clear buy or sell signal based on whether that value is above or below the current market price. Narratives automatically update as new news, guidance or earnings arrive, so your thesis can evolve rather than stay frozen in time. For Ivanhoe, for example, one investor might plug in very bullish assumptions around copper prices and successful ramp ups to support a fair value near CA$20.89, while a more cautious investor, focused on operational and geopolitical risks, might arrive closer to CA$12.42, and seeing where you sit between those views can help you decide if Ivanhoe looks attractively priced for your personal outlook.
Do you think there's more to the story for Ivanhoe Mines? Head over to our Community to see what others are saying!
This article by Simply Wall St is general in nature. We provide commentary based on historical data and analyst forecasts only using an unbiased methodology and our articles are not intended to be financial advice. It does not constitute a recommendation to buy or sell any stock, and does not take account of your objectives, or your financial situation. We aim to bring you long-term focused analysis driven by fundamental data. Note that our analysis may not factor in the latest price-sensitive company announcements or qualitative material. Simply Wall St has no position in any stocks mentioned.
Have feedback on this article? Concerned about the content? Get in touch with us directly. Alternatively, email editorial-team@simplywallst.com