
- PREMIUM
- LIVE QUOTES
- INSTITUTION
 Index Options
 State Street
 CME Group
 Nasdaq
 Cboe
Cboe TradingView
 Wall Street Journal
Reassessing MDU Resources Group’s Valuation After Its Recent 90-Day Share Price Rally
MDU Resources Group (MDU) has quietly pulled back about 2% over the past month after a strong run in the past 3 months, which sets up an interesting check on its current valuation.
See our latest analysis for MDU Resources Group.
At a share price of $19.26, MDU’s 19.0% 90 day share price return contrasts with a modest 1 year total shareholder return of 2.0%. This suggests that recent momentum is rebuilding after a quieter stretch.
If you are rethinking your utilities exposure, it can also be worth scanning fast growing stocks with high insider ownership for ideas where growth and insider conviction line up more clearly.
With MDU trading just below analyst targets after a sharp 90 day rally yet only modest long term returns, investors now face a key question: Is this a genuine value opportunity, or is the market already pricing in future growth?
Most Popular Narrative Narrative: 6% Undervalued
With MDU closing at $19.26 against a narrative fair value of $20.50, the story leans toward modest upside driven by steady, regulated growth.
Strong ongoing and future investment in U.S. infrastructure, including large pipeline expansion projects and potential new transmission or generation to serve data centers, positions MDU to benefit from robust construction demand and growing energy needs, providing significant future revenue and earnings uplift.
Curious how steady growth assumptions, richer profit margins, and a premium future earnings multiple all combine into that valuation? The full narrative unpacks the entire playbook.
Result: Fair Value of $20.50 (UNDERVALUED)
Have a read of the narrative in full and understand what's behind the forecasts.
However, that upside depends on execution, with faster than expected renewable adoption and rising operating costs both capable of squeezing returns and undermining today’s valuation case.
Find out about the key risks to this MDU Resources Group narrative.
Another Way to Look at Value
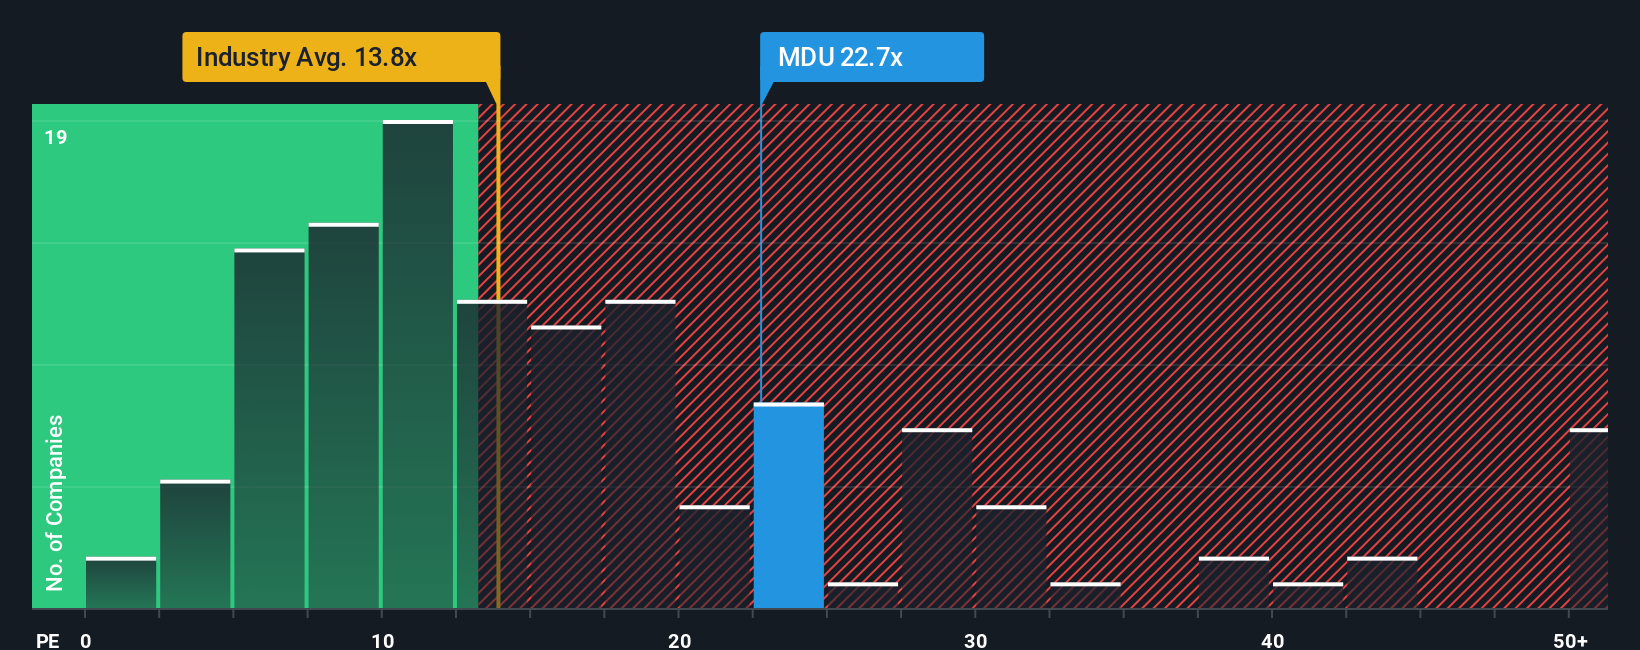
While the narrative fair value points to upside, the price to earnings lens flashes caution. MDU trades at 21.2 times earnings, richer than both peers at 18.7 times and the global gas utilities average at 14 times, and even above its 20.8 times fair ratio. That leaves less room for disappointment if growth or margins slip.
See what the numbers say about this price — find out in our valuation breakdown.
Build Your Own MDU Resources Group Narrative
If you see the story differently or would rather lean on your own research and assumptions, you can build a custom view in minutes using Do it your way.
A great starting point for your MDU Resources Group research is our analysis highlighting 2 key rewards and 2 important warning signs that could impact your investment decision.
Ready for more investment ideas?
Do not stop at MDU; use the Simply Wall Street Screener now to uncover targeted opportunities that other investors might overlook and stay a step ahead.
- Capture potential mispricings early by scanning these 906 undervalued stocks based on cash flows that may offer stronger upside based on their cash flow profiles.
- Supercharge your growth watchlist by targeting these 26 AI penny stocks positioned at the heart of the artificial intelligence boom.
- Lock in income-focused ideas by reviewing these 15 dividend stocks with yields > 3% that can strengthen your portfolio’s yield without sacrificing quality.
This article by Simply Wall St is general in nature. We provide commentary based on historical data and analyst forecasts only using an unbiased methodology and our articles are not intended to be financial advice. It does not constitute a recommendation to buy or sell any stock, and does not take account of your objectives, or your financial situation. We aim to bring you long-term focused analysis driven by fundamental data. Note that our analysis may not factor in the latest price-sensitive company announcements or qualitative material. Simply Wall St has no position in any stocks mentioned.
Have feedback on this article? Concerned about the content? Get in touch with us directly. Alternatively, email editorial-team@simplywallst.com