
- PREMIUM
- LIVE QUOTES
- INSTITUTIONS
 Index Options
 State Street
 CME Group
 Nasdaq
 Cboe
Cboe TradingView
 Wall Street Journal
SWCC (TSE:5805) stock performs better than its underlying earnings growth over last three years
Generally speaking, investors are inspired to be stock pickers by the potential to find the big winners. Mistakes are inevitable, but a single top stock pick can cover any losses, and so much more. For example, the SWCC Corporation (TSE:5805) share price is up a whopping 539% in the last three years, a handsome return for long term holders. And in the last month, the share price has gained 47%. We note that SWCC reported its financial results recently; luckily, you can catch up on the latest revenue and profit numbers in our company report. Anyone who held for that rewarding ride would probably be keen to talk about it.
Since it's been a strong week for SWCC shareholders, let's have a look at trend of the longer term fundamentals.
While markets are a powerful pricing mechanism, share prices reflect investor sentiment, not just underlying business performance. By comparing earnings per share (EPS) and share price changes over time, we can get a feel for how investor attitudes to a company have morphed over time.
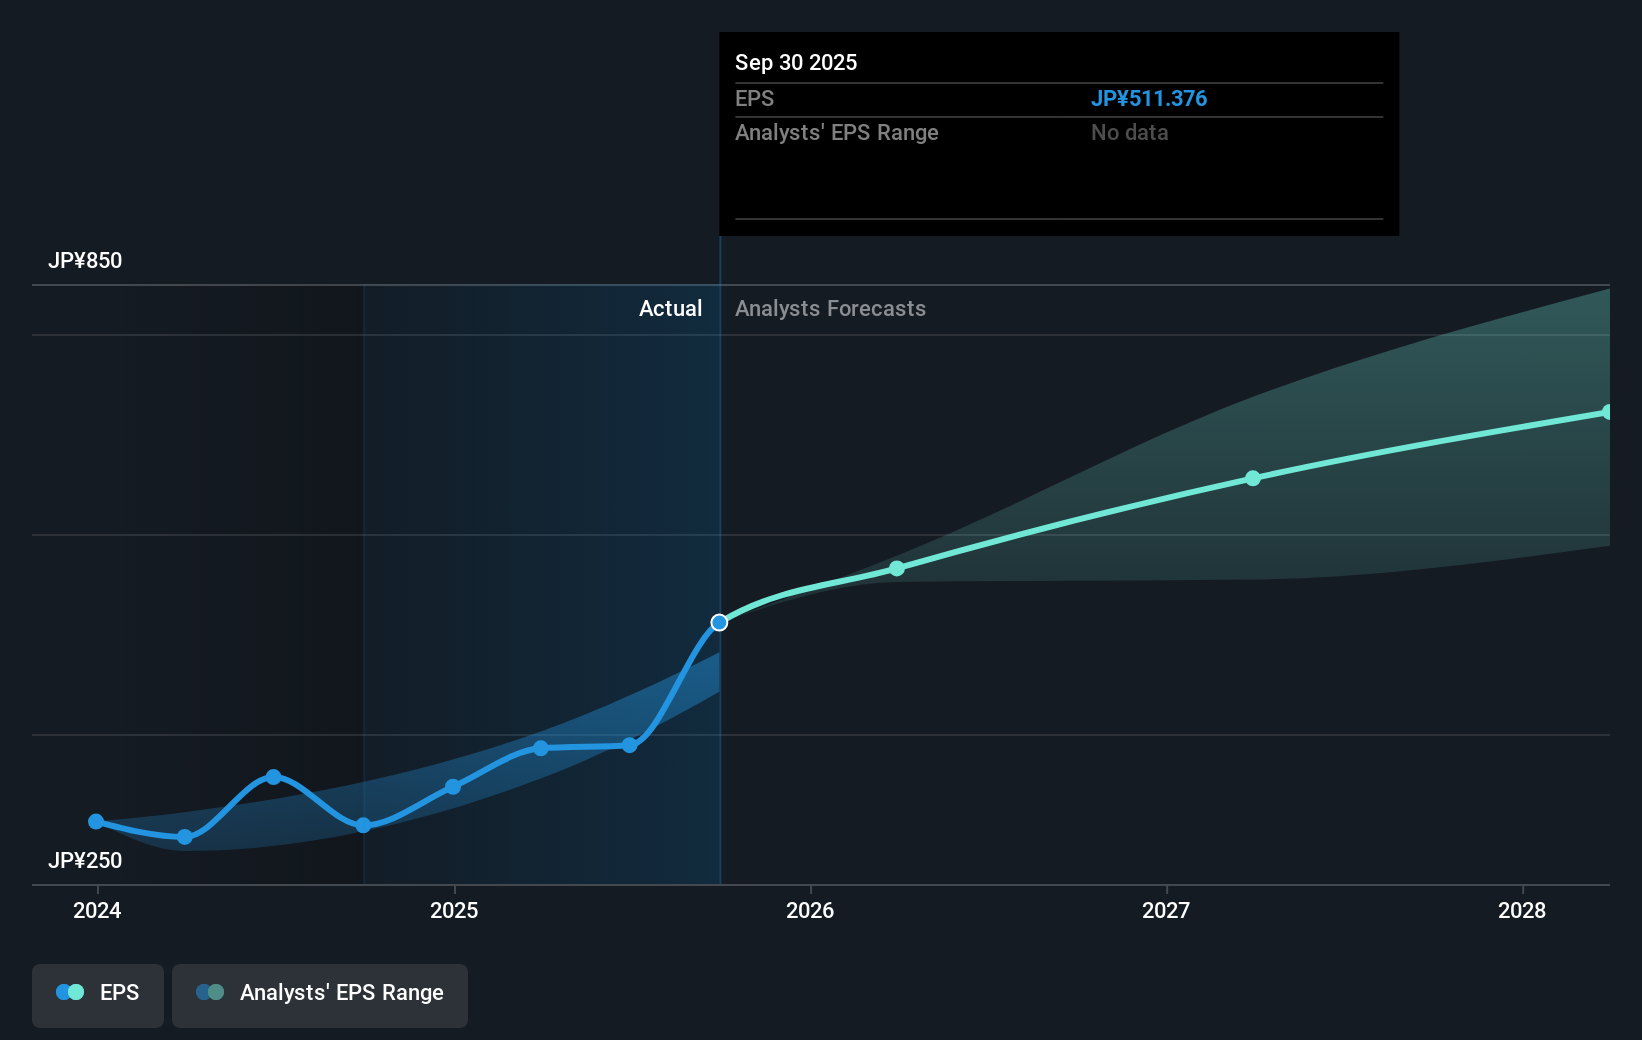
During three years of share price growth, SWCC achieved compound earnings per share growth of 16% per year. This EPS growth is lower than the 86% average annual increase in the share price. This suggests that, as the business progressed over the last few years, it gained the confidence of market participants. It is quite common to see investors become enamoured with a business, after a few years of solid progress.
You can see below how EPS has changed over time (discover the exact values by clicking on the image).
We know that SWCC has improved its bottom line lately, but is it going to grow revenue? Check if analysts think SWCC will grow revenue in the future.
What About Dividends?
When looking at investment returns, it is important to consider the difference between total shareholder return (TSR) and share price return. The TSR is a return calculation that accounts for the value of cash dividends (assuming that any dividend received was reinvested) and the calculated value of any discounted capital raisings and spin-offs. It's fair to say that the TSR gives a more complete picture for stocks that pay a dividend. We note that for SWCC the TSR over the last 3 years was 603%, which is better than the share price return mentioned above. The dividends paid by the company have thusly boosted the total shareholder return.
A Different Perspective
It's good to see that SWCC has rewarded shareholders with a total shareholder return of 42% in the last twelve months. And that does include the dividend. However, the TSR over five years, coming in at 48% per year, is even more impressive. It's always interesting to track share price performance over the longer term. But to understand SWCC better, we need to consider many other factors. To that end, you should learn about the 2 warning signs we've spotted with SWCC (including 1 which is significant) .
If you would prefer to check out another company -- one with potentially superior financials -- then do not miss this free list of companies that have proven they can grow earnings.
Please note, the market returns quoted in this article reflect the market weighted average returns of stocks that currently trade on Japanese exchanges.
Have feedback on this article? Concerned about the content? Get in touch with us directly. Alternatively, email editorial-team (at) simplywallst.com.
This article by Simply Wall St is general in nature. We provide commentary based on historical data and analyst forecasts only using an unbiased methodology and our articles are not intended to be financial advice. It does not constitute a recommendation to buy or sell any stock, and does not take account of your objectives, or your financial situation. We aim to bring you long-term focused analysis driven by fundamental data. Note that our analysis may not factor in the latest price-sensitive company announcements or qualitative material. Simply Wall St has no position in any stocks mentioned.