
- PREMIUM
- LIVE QUOTES
- INSTITUTION
 Index Options
 State Street
 CME Group
 Nasdaq
 Cboe
Cboe TradingView
 Wall Street Journal
BP Valuation Check After Energy Transition Moves And Strong 5 Year Share Price Gains
- If you are wondering whether BP is still a value play after its big run over the years, this breakdown will walk through what the current share price is really baking in.
- Despite a solid 27.0% gain over the last year and a hefty 111.1% return over 5 years, the stock has cooled recently, slipping 0.3% over the past week and 1.8% over the last month, though it is still up 12.3% year to date.
- Recent headlines have focused on BP's ongoing energy transition strategy and portfolio reshaping, including asset sales in legacy oil projects and fresh commitments to lower carbon investments. At the same time, debates around windfall taxes, capital allocation between dividends and buybacks, and the pace of decarbonization are all shaping how investors price BP's future.
- Right now BP scores just 2/6 on our valuation checks, suggesting the market is not significantly undervaluing it, at least by traditional metrics. Next we will unpack those valuation approaches in more detail and, by the end of the article, explore a more nuanced way to think about BP's true worth beyond the usual ratios.
BP scores just 2/6 on our valuation checks. See what other red flags we found in the full valuation breakdown.
Approach 1: BP Discounted Cash Flow (DCF) Analysis
A Discounted Cash Flow model estimates what a business is worth today by projecting the cash it can generate in the future and then discounting those cash flows back to the present.
For BP, the model uses a 2 Stage Free Cash Flow to Equity approach based on cash flows reported in dollars. The latest twelve month free cash flow stands at about $11.1 billion, and analysts expect BP to continue generating around $10 to $12 billion of free cash flow annually over the next decade. These projections start with detailed analyst estimates for the next few years. Simply Wall St then extrapolates growth beyond that period to build a 10 year view.
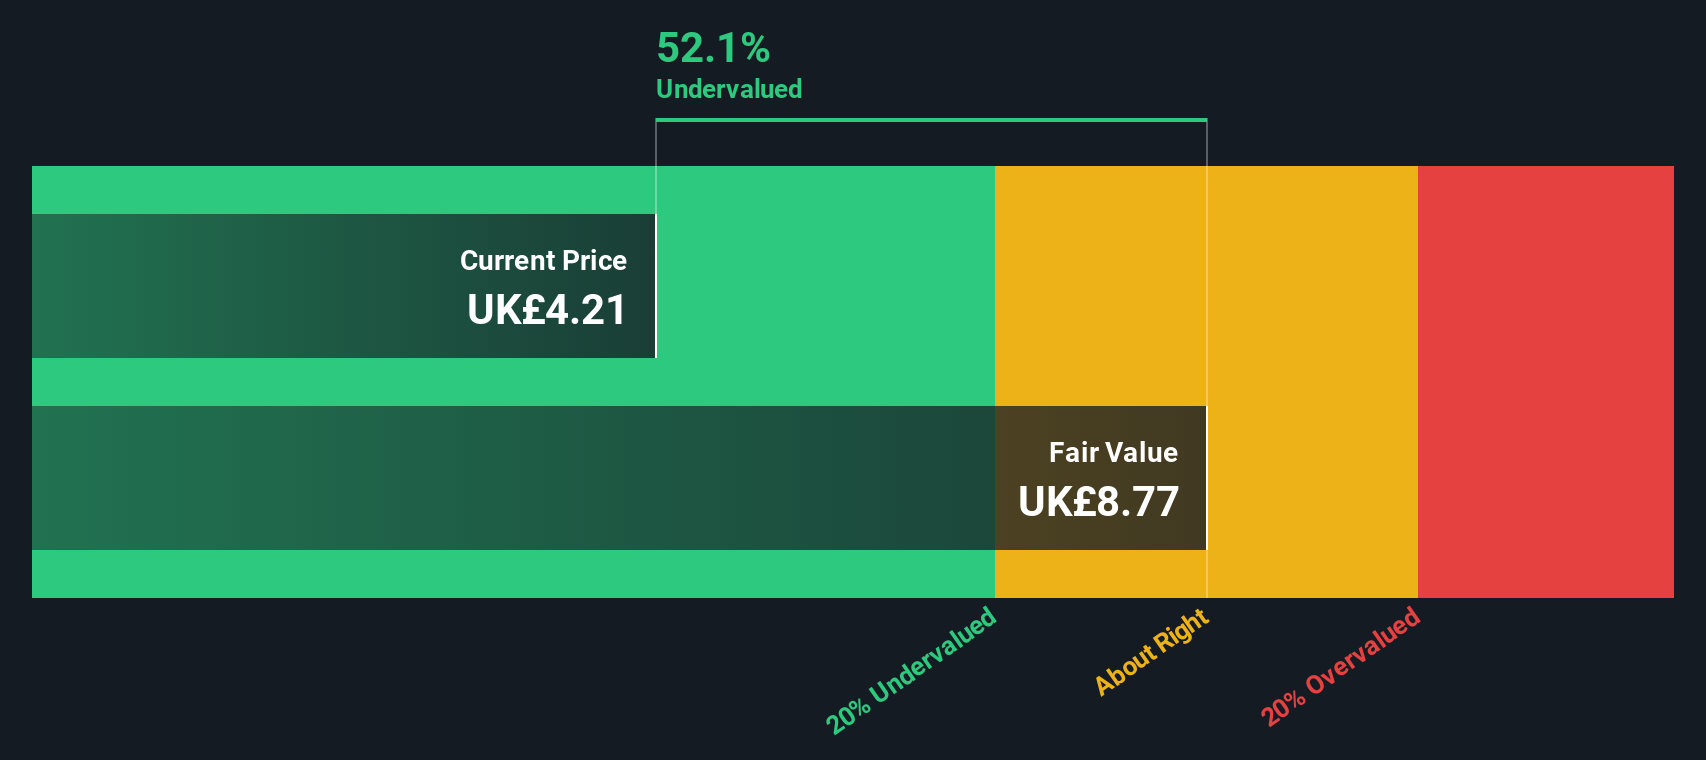
When all those future cash flows are discounted back to today, the model arrives at an intrinsic value of roughly $10.01 per share. That implies BP is trading at about a 54.8% discount to its fair value, suggesting the market is pricing in a much weaker long term cash flow profile than the model assumes.
Result: UNDERVALUED
Our Discounted Cash Flow (DCF) analysis suggests BP is undervalued by 54.8%. Track this in your watchlist or portfolio, or discover 906 more undervalued stocks based on cash flows.
Approach 2: BP Price vs Earnings
For profitable companies like BP, the price to earnings, or PE, ratio is a useful way to gauge how much investors are paying for each unit of current earnings. It distills a lot of expectations about future growth, risk, and profitability into a single, easy to compare number.
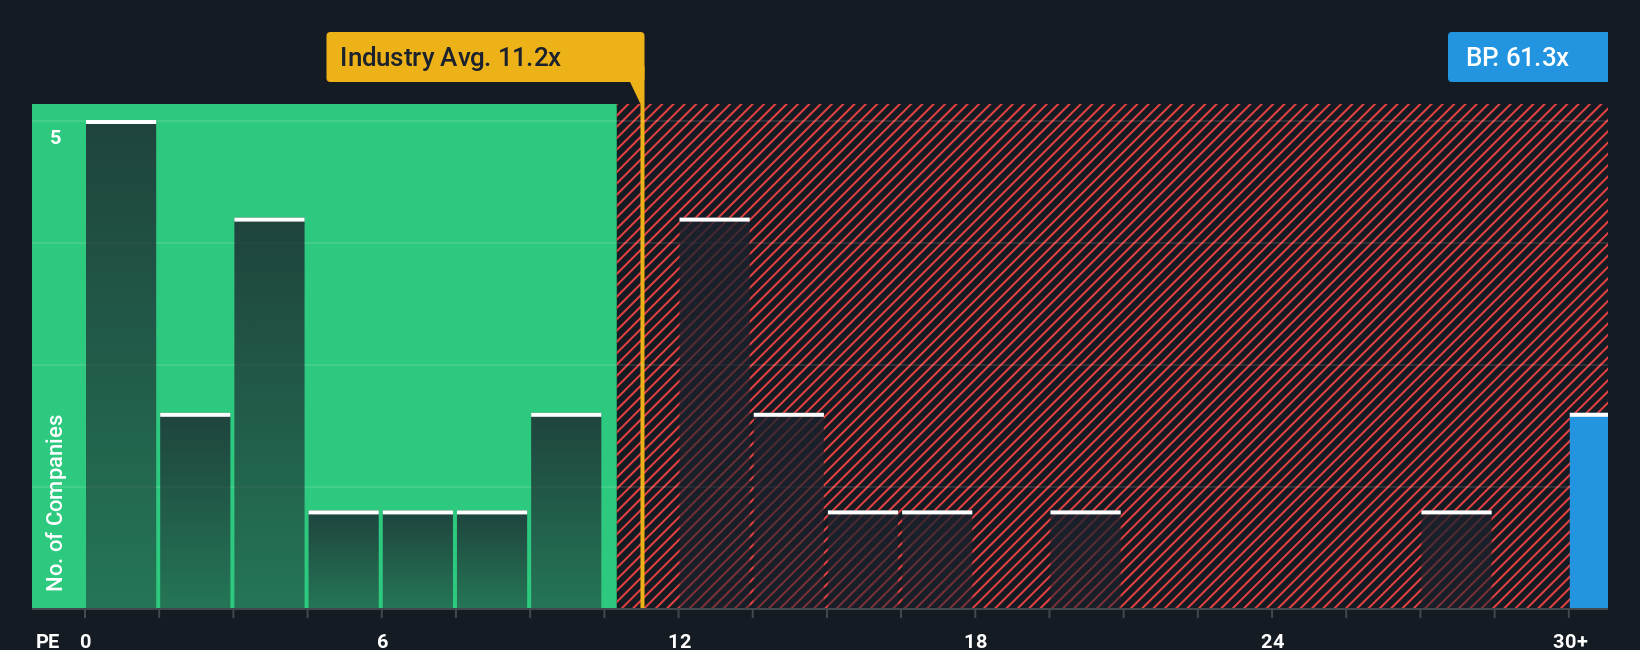
In general, faster growing and lower risk businesses can justify a higher PE ratio, while slower growing or riskier companies tend to trade on lower multiples. Right now BP trades on a PE of about 60.9x, well above both the Oil and Gas industry average of 13.7x and the broader peer group average of 11.2x. This suggests the market is assigning a premium to its earnings.
Simply Wall St also estimates a Fair Ratio for BP of 21.1x, which is the PE you might expect given its earnings growth outlook, margins, industry, size, and risk profile. This Fair Ratio is more tailored than a simple peer or industry comparison because it incorporates company specific fundamentals instead of relying on broad averages. Comparing BP’s current 60.9x PE to the 21.1x Fair Ratio points to a meaningful premium that is hard to justify purely on fundamentals.
Result: OVERVALUED
PE ratios tell one story, but what if the real opportunity lies elsewhere? Discover 1442 companies where insiders are betting big on explosive growth.
Upgrade Your Decision Making: Choose your BP Narrative
Earlier we mentioned that there is an even better way to understand valuation. Let us introduce you to Narratives, a simple framework on Simply Wall St's Community page that lets you attach a clear story about BP’s future to your own forecast for its revenue, earnings, margins, and fair value. You can then compare that fair value to today’s price to decide whether to buy, hold, or sell. Each Narrative automatically updates as new news or earnings arrive.
Different investors can see the same facts very differently. For example, one community member might build a confident growth Narrative that assumes BP’s portfolio streamlining, upstream discoveries, and cost reductions fully succeed and justify a fair value well above the current price. Another may focus on risks like capital misallocation, energy transition uncertainty, and margin pressure to create a far more cautious Narrative with a lower fair value than today’s price. By viewing these side by side, you can quickly understand how the story you believe about BP translates into numbers and, ultimately, into your investment decision.
Do you think there's more to the story for BP? Head over to our Community to see what others are saying!
This article by Simply Wall St is general in nature. We provide commentary based on historical data and analyst forecasts only using an unbiased methodology and our articles are not intended to be financial advice. It does not constitute a recommendation to buy or sell any stock, and does not take account of your objectives, or your financial situation. We aim to bring you long-term focused analysis driven by fundamental data. Note that our analysis may not factor in the latest price-sensitive company announcements or qualitative material. Simply Wall St has no position in any stocks mentioned.
Have feedback on this article? Concerned about the content? Get in touch with us directly. Alternatively, email editorial-team@simplywallst.com