
- PREMIUM
- LIVE QUOTES
- INSTITUTION
 Index Options
 State Street
 CME Group
 Nasdaq
 Cboe
Cboe TradingView
 Wall Street Journal
Is CarGurus Still an Opportunity After Flat 2025 Share Performance?
- Wondering if CarGurus is quietly becoming a bargain, or if the easy money has already been made? Let us unpack what the current share price is really implying about its future.
- CarGurus has crept up 1.6% over the last week and 5.2% over the last month, yet it is still roughly flat year to date at 0.3%. Zooming out, the stock is down 6.6% over the last year but up 177.0% over three years and 26.0% over five years, which says a lot about how sentiment and expectations have swung.
- Behind these moves, investors have been reacting to ongoing shifts in the online auto marketplace landscape. CarGurus has been pushing deeper into digital retail tools and dealer solutions that can smooth out the buying and selling process. At the same time, headlines around used car demand normalization and competition from other auto platforms have limited how aggressively the market is willing to re rate the stock.
- Right now, CarGurus scores just 2 out of 6 on our undervaluation checks, so the market is not extremely optimistic or deeply pessimistic based on the usual metrics. Next we will walk through the main valuation approaches investors are using, and then finish with a more nuanced way to judge what this business might really be worth.
CarGurus scores just 2/6 on our valuation checks. See what other red flags we found in the full valuation breakdown.
Approach 1: CarGurus Discounted Cash Flow (DCF) Analysis
A Discounted Cash Flow model estimates what a business is worth today by projecting its future cash flows and then discounting those back to the present.
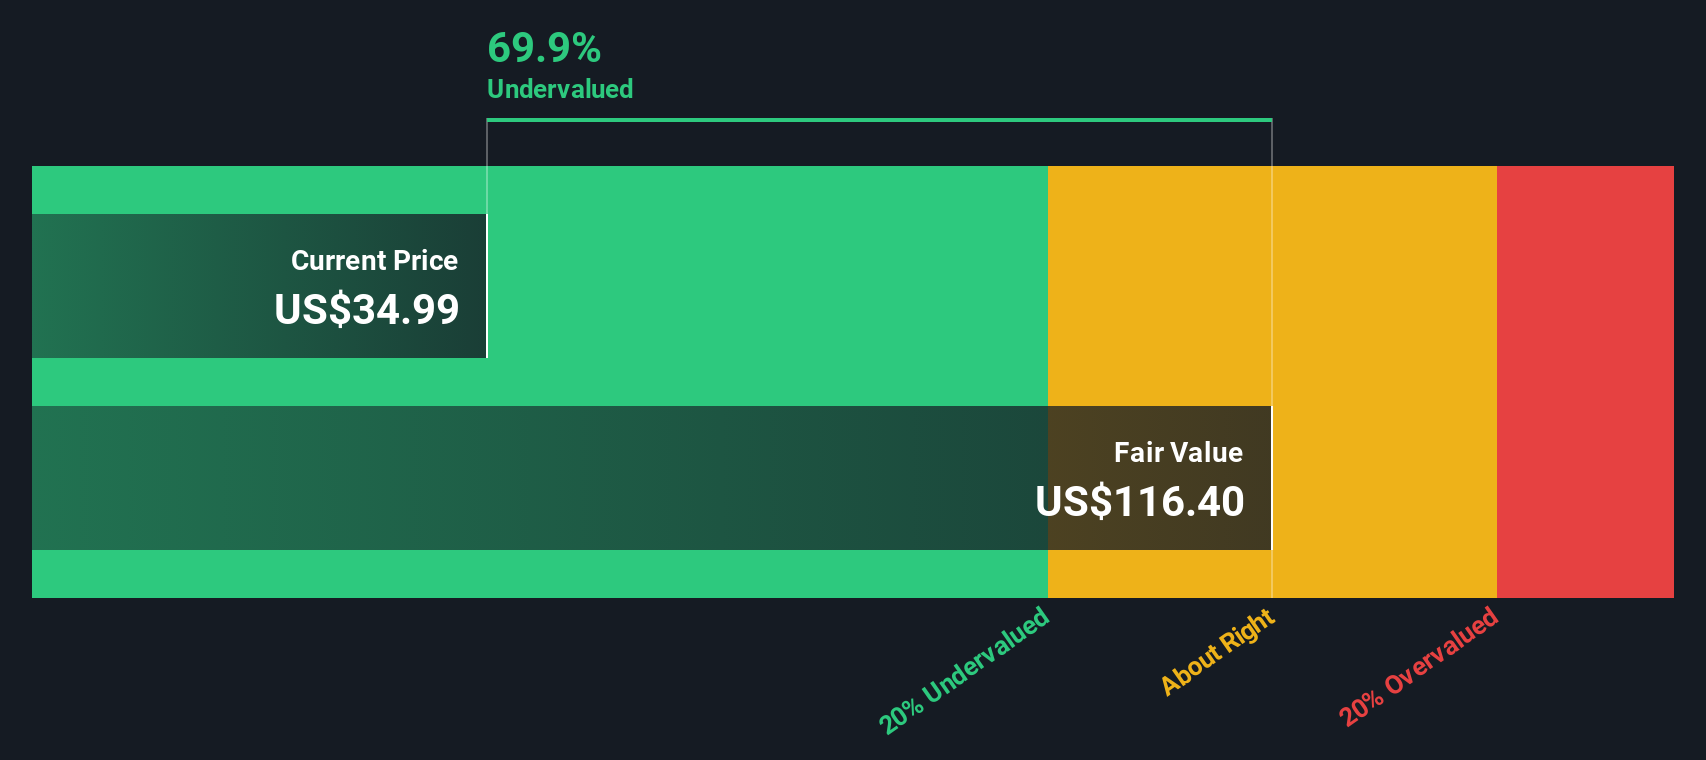
For CarGurus, the latest twelve months Free Cash Flow stands at about $234 million. Analysts expect this to rise steadily, with Simply Wall St translating their estimates and extrapolations into projected Free Cash Flow of around $1.07 billion by 2035. These forecasts use a 2 Stage Free Cash Flow to Equity model, which assumes faster growth in the near term that tapers off as the business matures.
When all those future cash flows are discounted back, the intrinsic value comes out at roughly $145 per share. Compared with the current market price, this implies CarGurus is trading at about a 75.3% discount to its estimated fair value. This suggests investors are pricing in much weaker prospects than the cash flow outlook implies.
Result: UNDERVALUED
Our Discounted Cash Flow (DCF) analysis suggests CarGurus is undervalued by 75.3%. Track this in your watchlist or portfolio, or discover 906 more undervalued stocks based on cash flows.
Approach 2: CarGurus Price vs Earnings
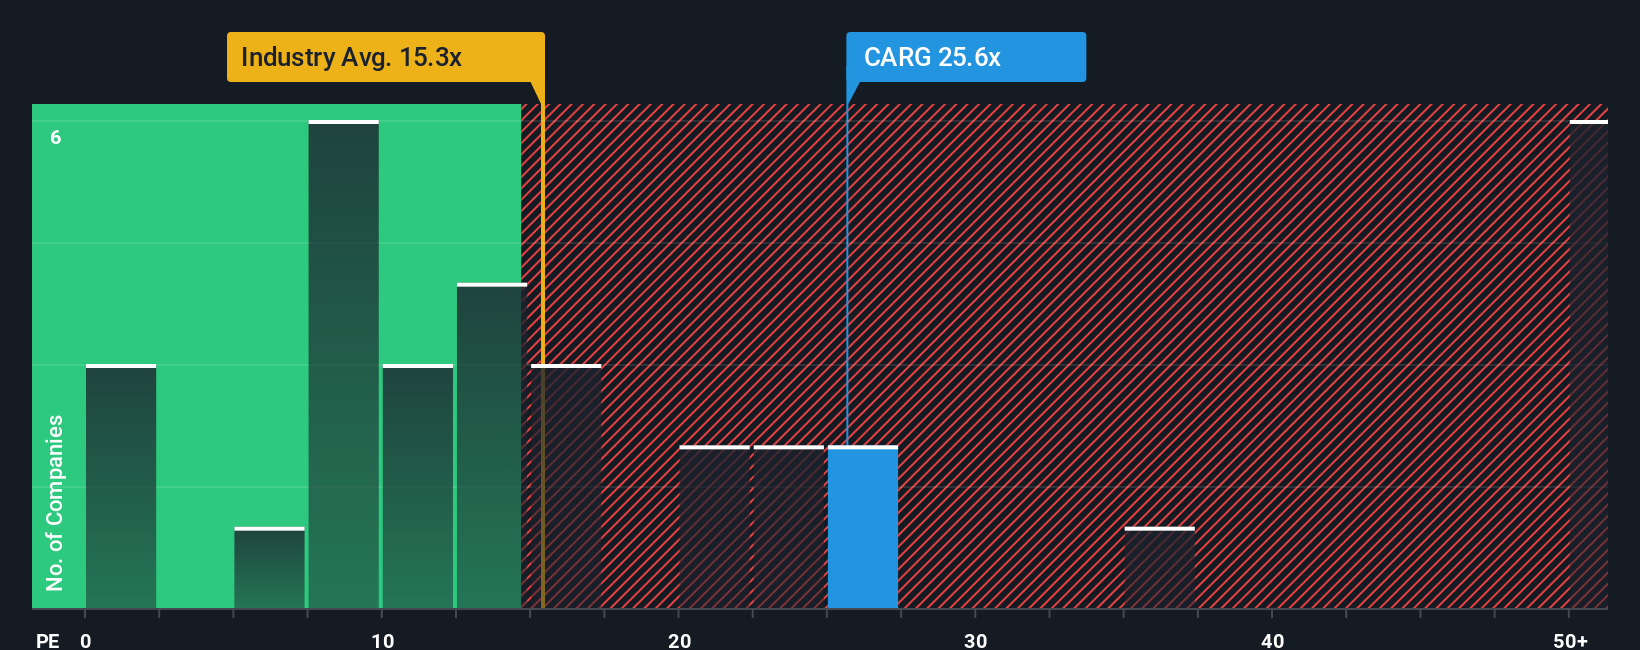
For a profitable business like CarGurus, the Price to Earnings ratio is a straightforward way to see what investors are paying for each dollar of current profit. In general, faster growth and lower risk justify a higher PE, while slower growth or higher uncertainty usually mean a lower, more conservative multiple.
CarGurus currently trades on a PE of about 22.5x, which is above both the Interactive Media and Services industry average of around 17.2x and the peer average of roughly 12.7x. At first glance, that premium suggests the market is already baking in stronger prospects than many of its peers. However, Simply Wall St’s Fair Ratio, which estimates what a justified PE should be after factoring in CarGurus specific growth outlook, margins, risks, industry, and size, comes out at about 21.2x.
This Fair Ratio is more informative than simple peer or industry comparisons because it adjusts for the company’s own fundamentals rather than assuming all businesses deserve the same multiple. With the current PE only slightly above the Fair Ratio, CarGurus appears somewhat expensive on earnings, but not by a wide margin.
Result: OVERVALUED
PE ratios tell one story, but what if the real opportunity lies elsewhere? Discover 1443 companies where insiders are betting big on explosive growth.
Upgrade Your Decision Making: Choose your CarGurus Narrative
Earlier we mentioned that there is an even better way to understand valuation, so let us introduce you to Narratives, a simple framework that lets you connect your view of a company’s story with a concrete forecast for its future revenue, earnings, and margins, and then translate that into a Fair Value you can compare to today’s share price.
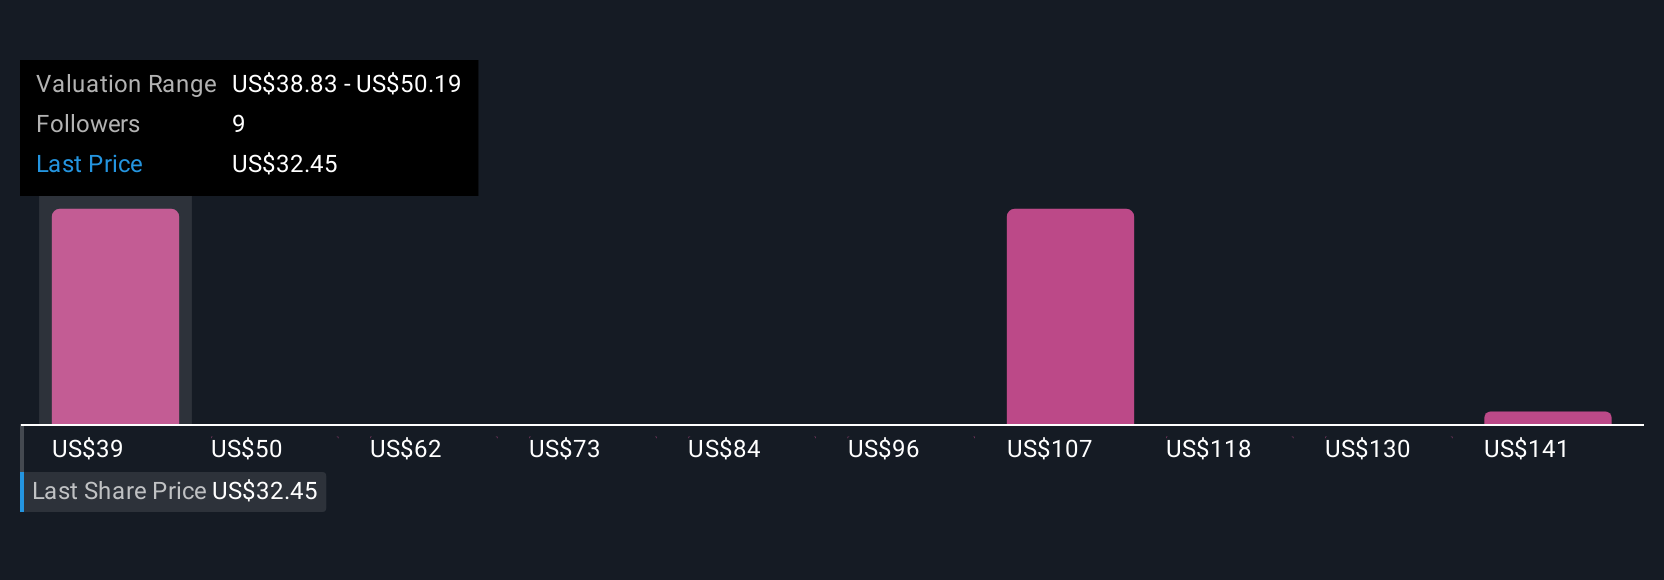
On Simply Wall St’s Community page, Narratives are easy to use and highly visual. They allow millions of investors to spell out why they think, for example, that CarGurus’ AI driven dealer tools, share repurchases, and international expansion will support revenue growth of around 6.7% a year, profit margins near 27%, and a Fair Value close to $40 per share. Alternatively, investors can take a more cautious stance that assumes slower growth, lower margins, and a Fair Value nearer $33. Because each Narrative is tied to live data, your Fair Value view updates dynamically as new news, earnings, or guidance is released, helping you decide when the gap between Fair Value and Price is wide enough to buy, trim, or sell.
Do you think there's more to the story for CarGurus? Head over to our Community to see what others are saying!
This article by Simply Wall St is general in nature. We provide commentary based on historical data and analyst forecasts only using an unbiased methodology and our articles are not intended to be financial advice. It does not constitute a recommendation to buy or sell any stock, and does not take account of your objectives, or your financial situation. We aim to bring you long-term focused analysis driven by fundamental data. Note that our analysis may not factor in the latest price-sensitive company announcements or qualitative material. Simply Wall St has no position in any stocks mentioned.
Have feedback on this article? Concerned about the content? Get in touch with us directly. Alternatively, email editorial-team@simplywallst.com