
- PREMIUM
- LIVE QUOTES
- INSTITUTION
 Index Options
 State Street
 CME Group
 Nasdaq
 Cboe
Cboe TradingView
 Wall Street Journal
Is Appian’s Share Price Run in 2025 Justified by Its Fundamentals?
- Wondering if Appian at around $40.96 is a hidden opportunity or a value trap? You are not alone, and this article is going to unpack exactly what you are paying for today.
- After a choppy few years, the stock has climbed 1.4% over the last week, 39.7% over the past month, and 23.4% year to date, even though the 5 year return still sits at a steep -73.2%.
- Recent interest around low code and automation platforms has put Appian back on some investors radar, especially as enterprises look for ways to cut development costs and speed up internal tools. At the same time, ongoing competition in the workflow and automation space has raised questions about how durable Appian growth can be relative to bigger rivals.
- On our framework, Appian currently scores a 2/6 valuation check score, suggesting it screens as undervalued on only a couple of traditional metrics. Next we will dig into those standard valuation approaches and, by the end, look at a more complete way to think about what this business might really be worth.
Appian scores just 2/6 on our valuation checks. See what other red flags we found in the full valuation breakdown.
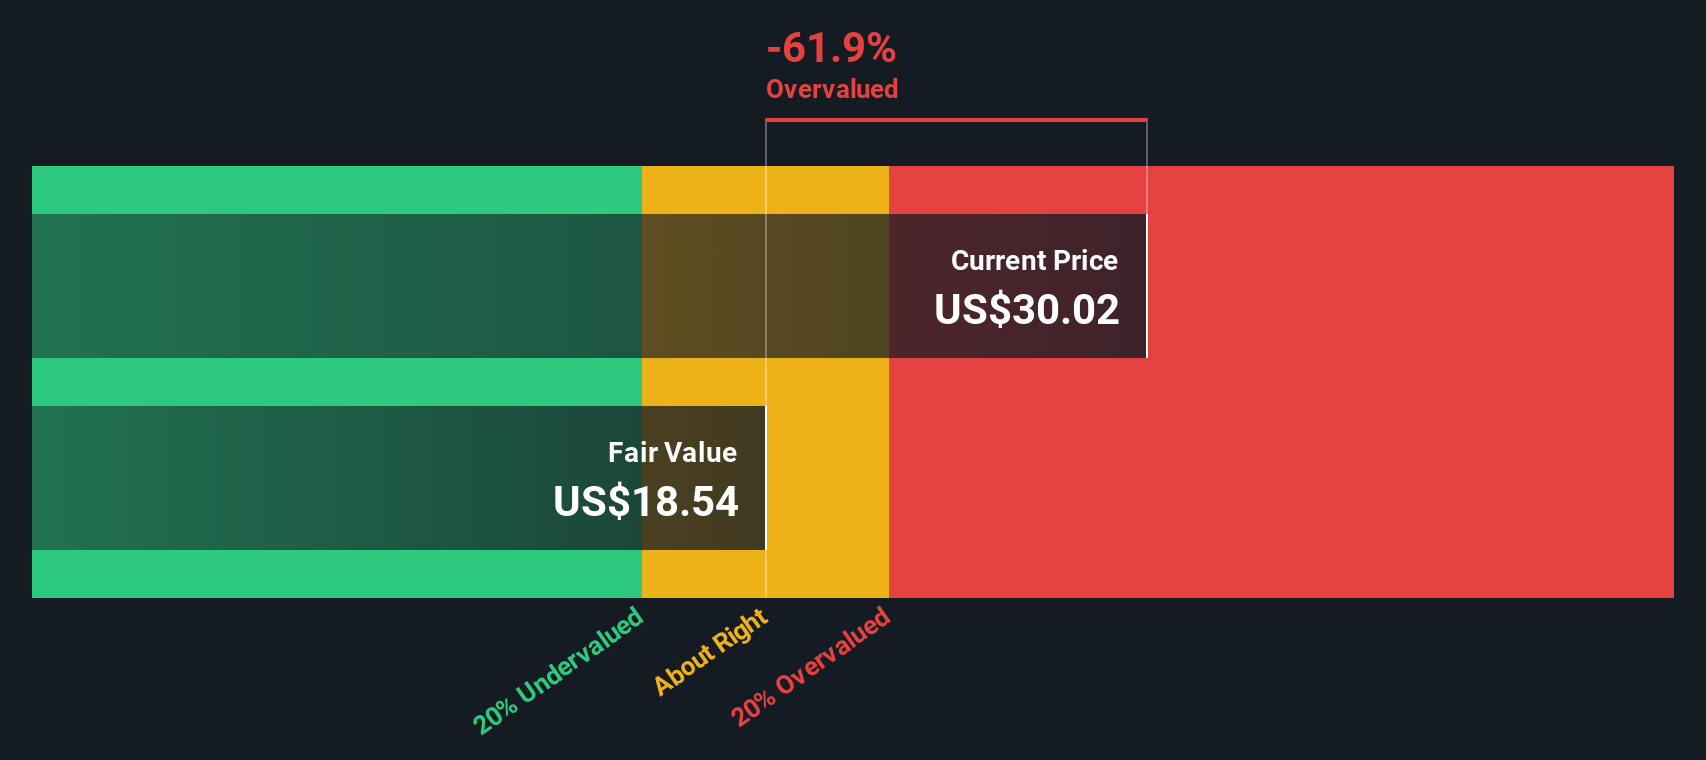
Approach 1: Appian Discounted Cash Flow (DCF) Analysis
The Discounted Cash Flow model estimates what a business is worth today by extrapolating its future cash flow projections and discounting them back to the present. For Appian, the model uses a 2 Stage Free Cash Flow to Equity approach based on cash flows reported in $.
Appian is currently generating about $68.3 million in free cash flow, with analyst forecasts and extrapolations pointing to around $155.6 million in free cash flow by 2035. In the nearer term, projections step up from roughly $67.8 million in 2026 to $94.9 million in 2027, then continue to grow at gradually slowing rates over the following years as the business matures.
When these projected cash flows are discounted back using Simply Wall St assumptions, the model arrives at an intrinsic value of roughly $27.29 per share. Compared with the current price of about $40.96, the DCF implies Appian is approximately 50.1% overvalued, suggesting the recent share price strength is running ahead of the company cash flow fundamentals.
Result: OVERVALUED
Our Discounted Cash Flow (DCF) analysis suggests Appian may be overvalued by 50.1%. Discover 906 undervalued stocks or create your own screener to find better value opportunities.
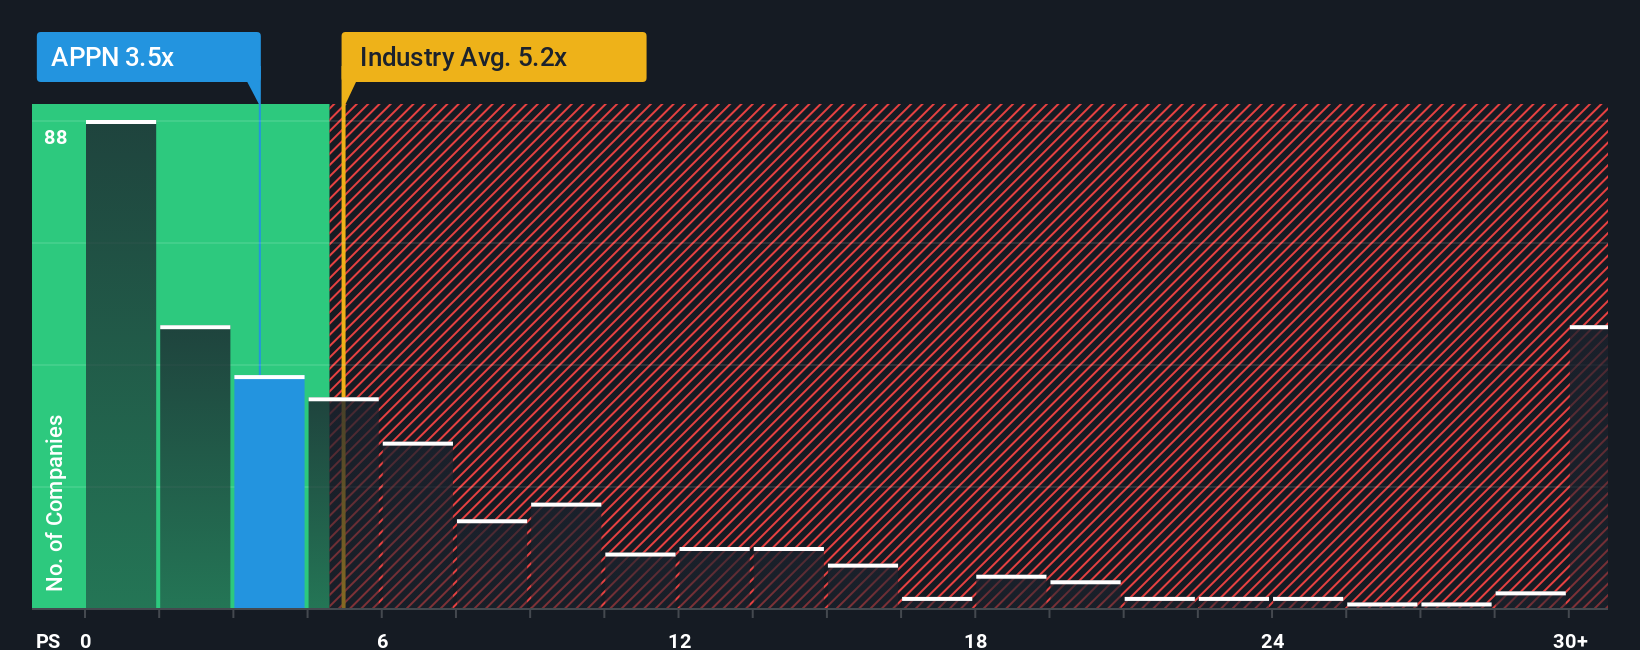
Approach 2: Appian Price vs Sales
For a business like Appian that is still working toward consistent profitability, the price to sales ratio is often a more reliable yardstick because it focuses on how much investors are paying for each dollar of revenue rather than volatile or negative earnings.
In general, faster growing and less risky software companies can justify higher sales multiples. Slower growth or higher uncertainty should pull that multiple down toward, or even below, the sector norm. Appian currently trades at about 4.38x sales, which is above the peer average of roughly 3.19x but a bit below the broader Software industry average of around 4.99x.
The Simply Wall St Fair Ratio framework goes a step further by estimating what a reasonable price to sales multiple should be, given Appian’s growth outlook, profit profile, size, industry positioning, and risk factors. For Appian, that Fair Ratio comes out to about 4.71x. This suggests the market price is slightly below what those fundamentals might justify and points to modest potential upside if the company can execute on its strategy.
Result: UNDERVALUED
PS ratios tell one story, but what if the real opportunity lies elsewhere? Discover 1443 companies where insiders are betting big on explosive growth.
Upgrade Your Decision Making: Choose your Appian Narrative
Earlier we mentioned that there is an even better way to understand valuation, so let us introduce Narratives, a simple way for you to spell out the story you believe about Appian and directly link that story to a financial forecast and a fair value estimate. A Narrative on Simply Wall St turns your view of the business, like how fast revenue might grow, what margins could look like, and how durable Appian competitive edge is, into concrete forecasts and a calculated fair value that you can easily compare with today price to help inform a decision about whether to buy, hold, or sell. Narratives live on the Community page of the platform, are used by millions of investors, and update dynamically as new information such as quarterly earnings, major product announcements, or industry news is released. This helps your fair value view stay current without you rebuilding the whole model. For example, one Appian Narrative might lean bullish and justify a fair value near the top of recent targets around $42.0, while a more cautious Narrative could support a fair value closer to $29.0, illustrating how different but clearly defined stories can coexist and guide different decisions.
Do you think there's more to the story for Appian? Head over to our Community to see what others are saying!

This article by Simply Wall St is general in nature. We provide commentary based on historical data and analyst forecasts only using an unbiased methodology and our articles are not intended to be financial advice. It does not constitute a recommendation to buy or sell any stock, and does not take account of your objectives, or your financial situation. We aim to bring you long-term focused analysis driven by fundamental data. Note that our analysis may not factor in the latest price-sensitive company announcements or qualitative material. Simply Wall St has no position in any stocks mentioned.
Have feedback on this article? Concerned about the content? Get in touch with us directly. Alternatively, email editorial-team@simplywallst.com