
Is Chubb Still Attractively Priced After Doubling Over the Last 5 Years?
- Wondering if Chubb is still a smart buy at around $295 a share, or if the easy money has already been made? Here is a closer look at what the current price is really implying about its future.
- Despite a modest 1.1% dip over the last week, Chubb is still up 3.1% over the past month, 8.1% year to date, and 107.5% over 5 years, which indicates that the long term narrative has been decidedly bullish.
- Recently, the market has been reacting to Chubb's steady position in the global insurance space, with investors weighing its disciplined underwriting against a backdrop of shifting interest rates and evolving catastrophe risk models. At the same time, management's continued focus on specialty lines and international expansion has reinforced the view that Chubb can continue compounding book value even as the cycle matures.
- On our simple valuation framework, Chubb scores a 4/6 for being undervalued across key checks, which suggests the stock may still offer reasonable value rather than relying purely on momentum. Next, we will walk through the main valuation approaches behind that score, and finish with a more nuanced way to think about what Chubb is worth in a long term portfolio context.
Approach 1: Chubb Excess Returns Analysis
The Excess Returns model looks at how much value Chubb creates over and above the return that shareholders reasonably demand on their equity capital. Instead of focusing on short term earnings, it asks whether Chubb can consistently earn attractive returns on its book value and reinvest those profits at similar rates.
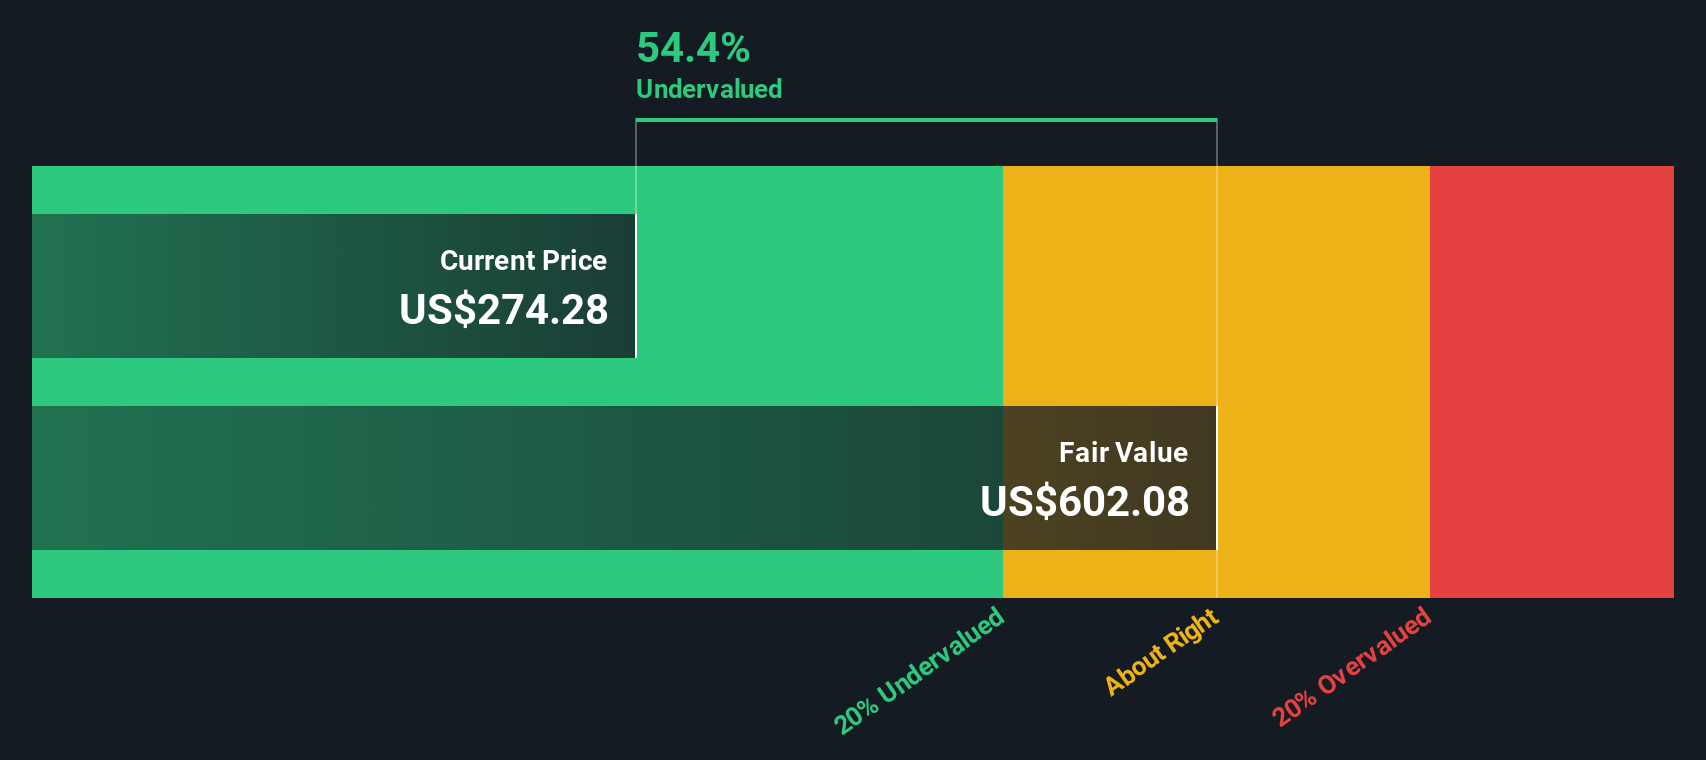
For Chubb, analysts expect a stable earnings power of $28.51 per share, supported by an average return on equity of 13.60%. With a book value of $182.22 per share today and a stable book value estimate of $209.68 per share, the model assumes the company can keep compounding shareholder equity at healthy rates over time. After accounting for the cost of equity of $13.90 per share, Chubb is projected to generate an excess return of $14.61 per share. This represents the value created beyond what investors require.
Putting these inputs together, the Excess Returns model indicates an intrinsic value that is about 54.2% above the current share price. On this basis, the stock screens as materially undervalued at current levels.
Result: UNDERVALUED
Our Excess Returns analysis suggests Chubb is undervalued by 54.2%. Track this in your watchlist or portfolio, or discover 912 more undervalued stocks based on cash flows.
Approach 2: Chubb Price vs Earnings
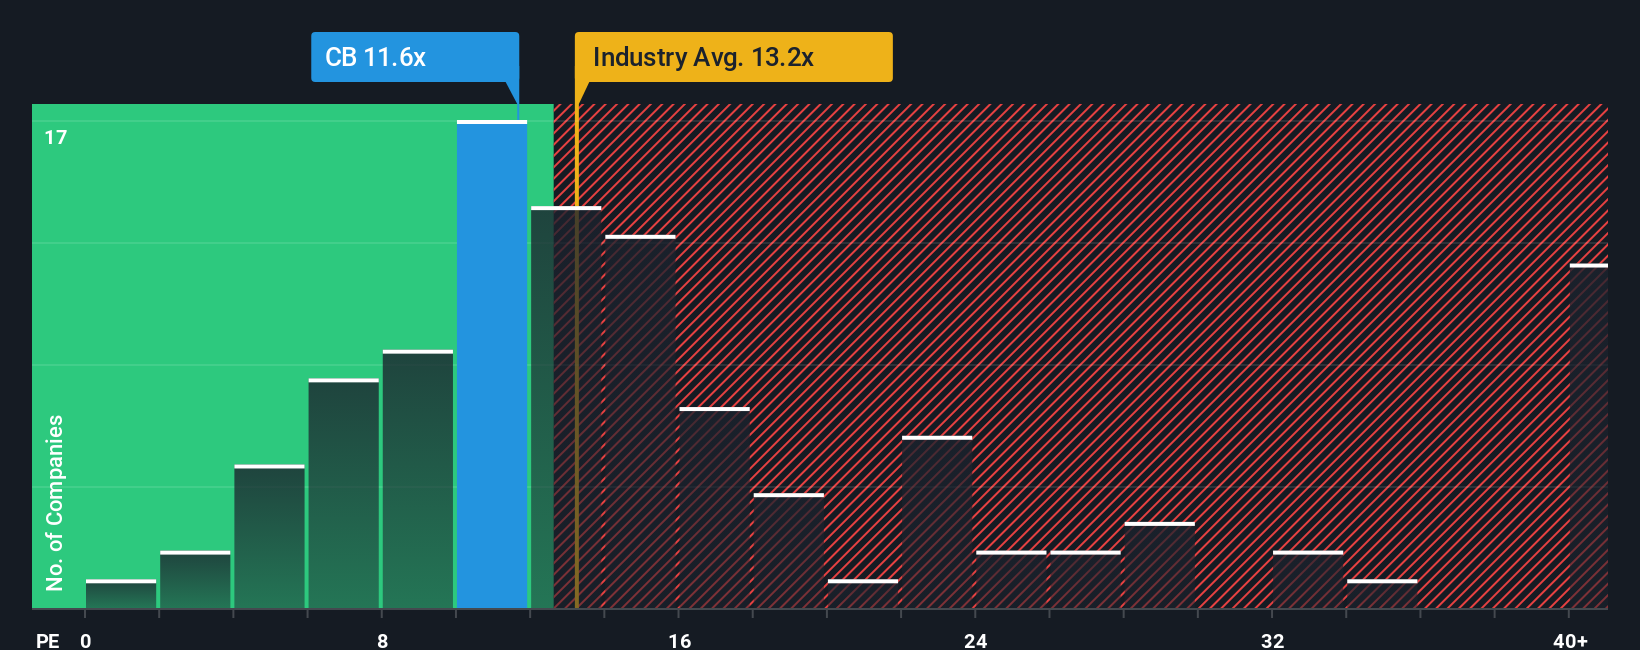
For a consistently profitable insurer like Chubb, the price to earnings, or PE, ratio is a practical way to gauge what investors are willing to pay for each dollar of current earnings. In general, faster growth and lower perceived risk justify a higher PE, while slower growth or elevated risk point to a lower, more conservative multiple.
Chubb currently trades on a PE of about 12x, which sits slightly below the broader Insurance industry average of around 12.8x and above the peer group average of roughly 10x. To sharpen this view, Simply Wall St uses a proprietary Fair Ratio, which estimates what PE investors might reasonably pay once factors such as earnings growth, profitability, size and risk profile are all taken into account. For Chubb, that Fair Ratio comes out at about 13.7x. This suggests the stock could warrant a somewhat higher multiple than the market is currently assigning.
Because the Fair Ratio incorporates more company specific drivers than a simple peer or industry comparison, it offers a more tailored benchmark for valuation. With the current PE below this Fair Ratio, Chubb screens as modestly undervalued on an earnings multiple basis.
Result: UNDERVALUED
PE ratios tell one story, but what if the real opportunity lies elsewhere? Discover 1442 companies where insiders are betting big on explosive growth.
Upgrade Your Decision Making: Choose your Chubb Narrative
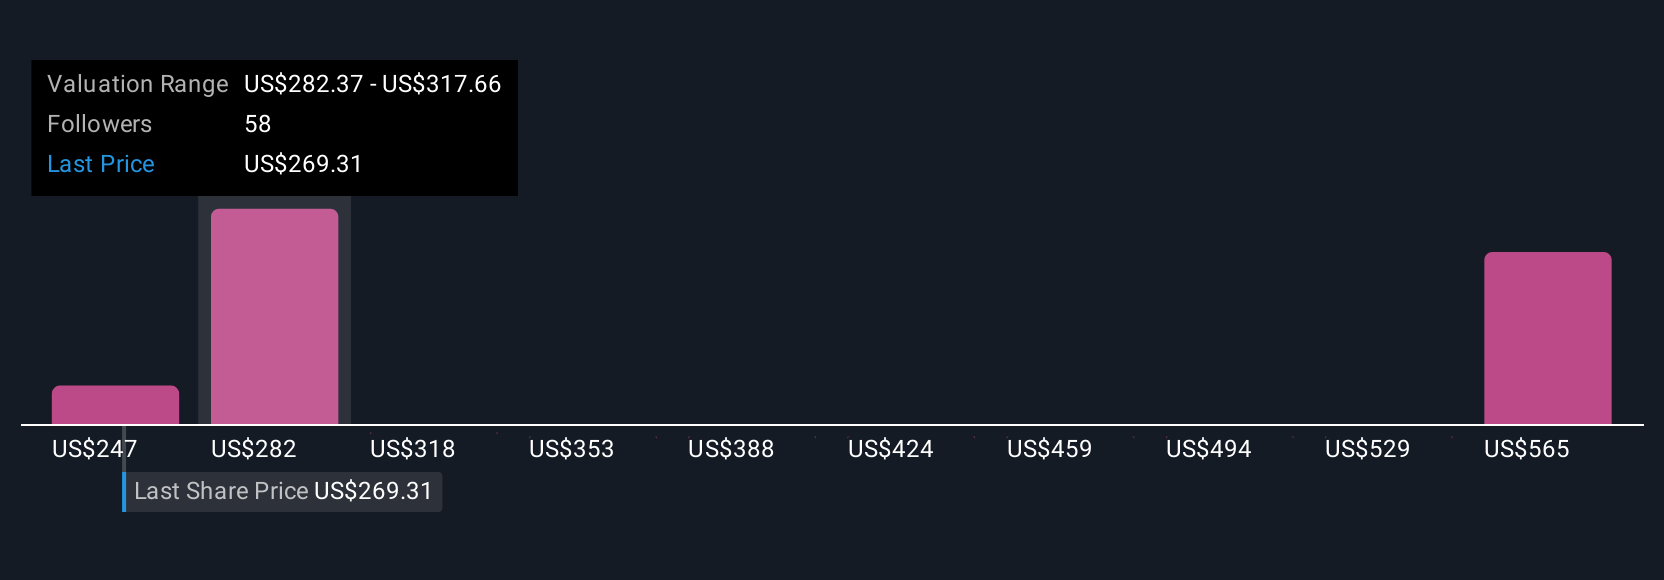
Earlier we mentioned that there is an even better way to understand valuation, so let us introduce you to Narratives, a simple framework that lets you write the story behind your numbers by connecting your view of a company’s future revenues, earnings and margins to a concrete fair value estimate. A Narrative on Simply Wall St starts with your perspective on Chubb’s business prospects, translates that story into a forward looking financial forecast, and then turns that forecast into a fair value that you can easily compare with today’s share price to decide whether to buy, hold, or sell. Narratives live inside the Community page on Simply Wall St, where millions of investors share and refine their views, and they automatically update as new information arrives, such as earnings releases, major news, or changes to key assumptions. For example, one Chubb Narrative might lean conservative with a fair value near about 247 dollars, while a more optimistic Narrative that assumes stronger margins and a higher future PE might see fair value closer to roughly 308 dollars, and the platform helps you see which story you believe in and what that implies for your own decision.
For Chubb, however, here are previews of two leading Chubb Narratives that make comparison straightforward:
Fair value in this narrative: $307.95 per share
Implied undervaluation vs last close: 4.3%
Revenue growth assumption: -4.7%
- Expects international expansion, specialty lines and digital distribution to support durable earnings growth despite near term revenue contraction.
- Sees disciplined underwriting, rising margins and capital returns via buybacks and dividends supporting steady EPS compounding.
- Views the current price as slightly below a fair value that is anchored around consensus forecasts and a modestly higher future PE.
Fair value in this narrative: $247.08 per share
Implied overvaluation vs last close: 19.3%
Revenue growth assumption: 2.6%
- Highlights intense competition, regulatory complexity and technological disruption as structural headwinds for returns.
- Emphasizes catastrophe exposure, climate risk and underwriting uncertainty as potential drags on long term profitability.
- Concludes that investors may be paying too much for Chubb's growth profile relative to its risk backdrop and capital needs.
Taken together, these Narratives frame the debate around Chubb's valuation in a way that is directly tied to explicit assumptions about growth, margins, risk and multiples, and they provide a transparent starting point for considering whether the stock aligns with an individual long term portfolio approach.
Do you think there's more to the story for Chubb? Head over to our Community to see what others are saying!
This article by Simply Wall St is general in nature. We provide commentary based on historical data and analyst forecasts only using an unbiased methodology and our articles are not intended to be financial advice. It does not constitute a recommendation to buy or sell any stock, and does not take account of your objectives, or your financial situation. We aim to bring you long-term focused analysis driven by fundamental data. Note that our analysis may not factor in the latest price-sensitive company announcements or qualitative material. Simply Wall St has no position in any stocks mentioned.
Have feedback on this article? Concerned about the content? Get in touch with us directly. Alternatively, email editorial-team@simplywallst.com