
Is ServiceNow’s AI Push Enough to Support Its Lofty 2025 Valuation?
- If you are wondering whether ServiceNow is a bargain or just an expensive growth story at today’s price, you are not alone. This breakdown is designed to cut through the noise and focus on what the numbers really say about value.
- After a choppy stretch, the stock is up about 4.5% over the last week but still down around 5.5% over the past month and roughly 20.4% year to date. A 25.3% slide over the past year contrasts sharply with its strong 111.7% three year gain.
- Recent headlines have centered on ServiceNow’s push deeper into AI driven workflows and platform automation partnerships. This helps explain why investors have been willing to look past short term volatility. At the same time, growing competition in enterprise SaaS and shifting market sentiment toward high multiple tech names have added a fresh layer of risk to the story.
- On our framework, ServiceNow currently scores 2 out of 6 on valuation checks, suggesting it only screens as undervalued on a couple of metrics. Next, we will unpack DCFs, multiples, and intrinsic value models, then finish with a more intuitive way to think about what the stock is really worth.
ServiceNow scores just 2/6 on our valuation checks. See what other red flags we found in the full valuation breakdown.
Approach 1: ServiceNow Discounted Cash Flow (DCF) Analysis
A Discounted Cash Flow model estimates what a business is worth by projecting its future cash flows and then discounting them back to today’s dollars, using a required rate of return. For ServiceNow, the model uses a 2 Stage Free Cash Flow to Equity approach based on its current and expected free cash generation.
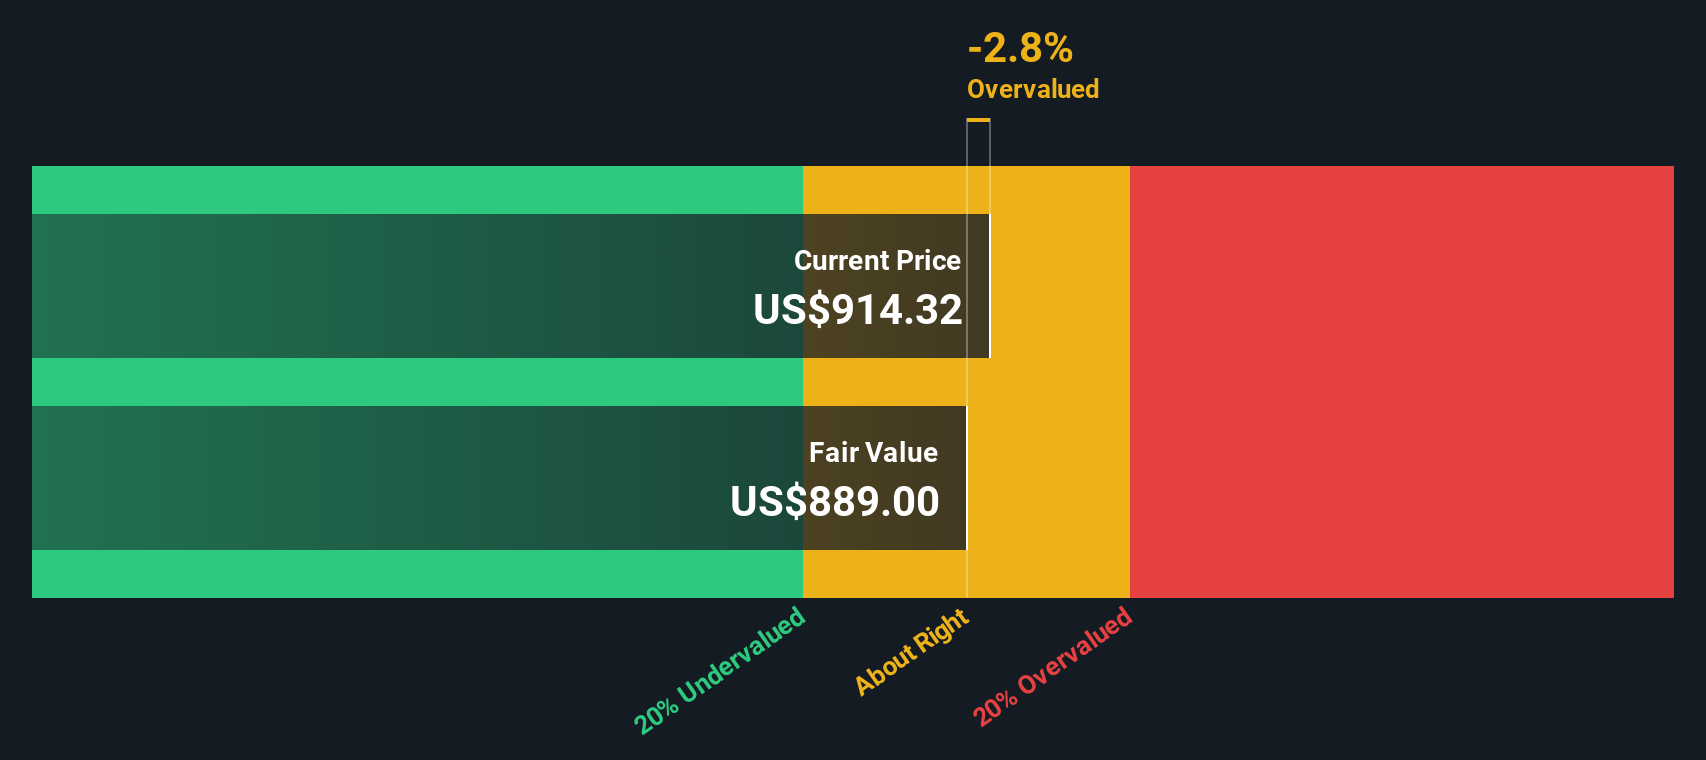
ServiceNow generated around $3.88 billion in Free Cash Flow over the last twelve months. Analyst forecasts plus Simply Wall St extrapolations see this rising to roughly $14.61 billion in annual FCF by 2035. Those future cash flows, all in $, are discounted back using a rate that implies an intrinsic value of about $931.65 per share.
Compared with the current share price, this DCF suggests the stock is about 10.0% undervalued, meaning the market is not fully pricing in the projected growth in cash generation.
Result: UNDERVALUED
ServiceNow is fairly valued according to our Discounted Cash Flow (DCF), but this can change at a moment's notice. Track the value in your watchlist or portfolio and be alerted on when to act.
Approach 2: ServiceNow Price vs Earnings
For profitable, mature growth companies like ServiceNow, the price to earnings ratio is often the clearest shorthand for how much investors are willing to pay today for each dollar of current profits. It ties valuation directly to earnings, which generally drive share prices over the long term.
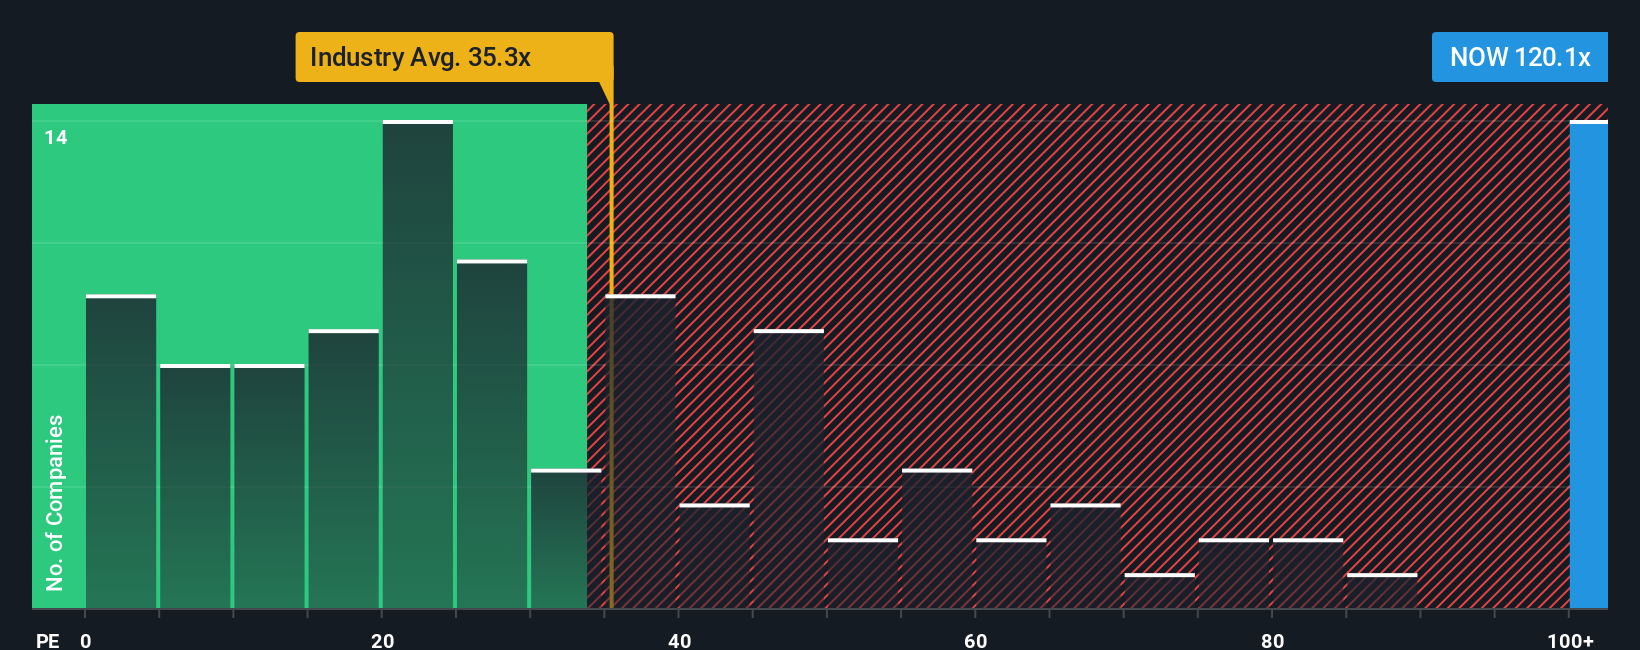
What counts as a fair PE depends on how quickly earnings are expected to grow and how risky that growth is. Faster, more reliable growth typically justifies a higher multiple, while slower or more uncertain growth should trade closer to the market or sector average. ServiceNow currently trades on a rich 100.55x PE, well above the broader Software industry average of 31.41x and also above its peer group average of 56.46x, signaling very elevated expectations.
Simply Wall St’s Fair Ratio framework estimates what a more reasonable PE should be for ServiceNow at about 46.26x, based on its earnings growth outlook, margins, risk profile, industry and market cap. This bespoke fair value anchor is more informative than a simple peer or industry comparison because it integrates company specific fundamentals rather than assuming all software names deserve similar multiples. Compared with the current 100.55x PE, the Fair Ratio indicates that ServiceNow is trading at a substantial premium that is difficult to justify on fundamentals alone.
Result: OVERVALUED
PE ratios tell one story, but what if the real opportunity lies elsewhere? Discover 1442 companies where insiders are betting big on explosive growth.
Upgrade Your Decision Making: Choose your ServiceNow Narrative
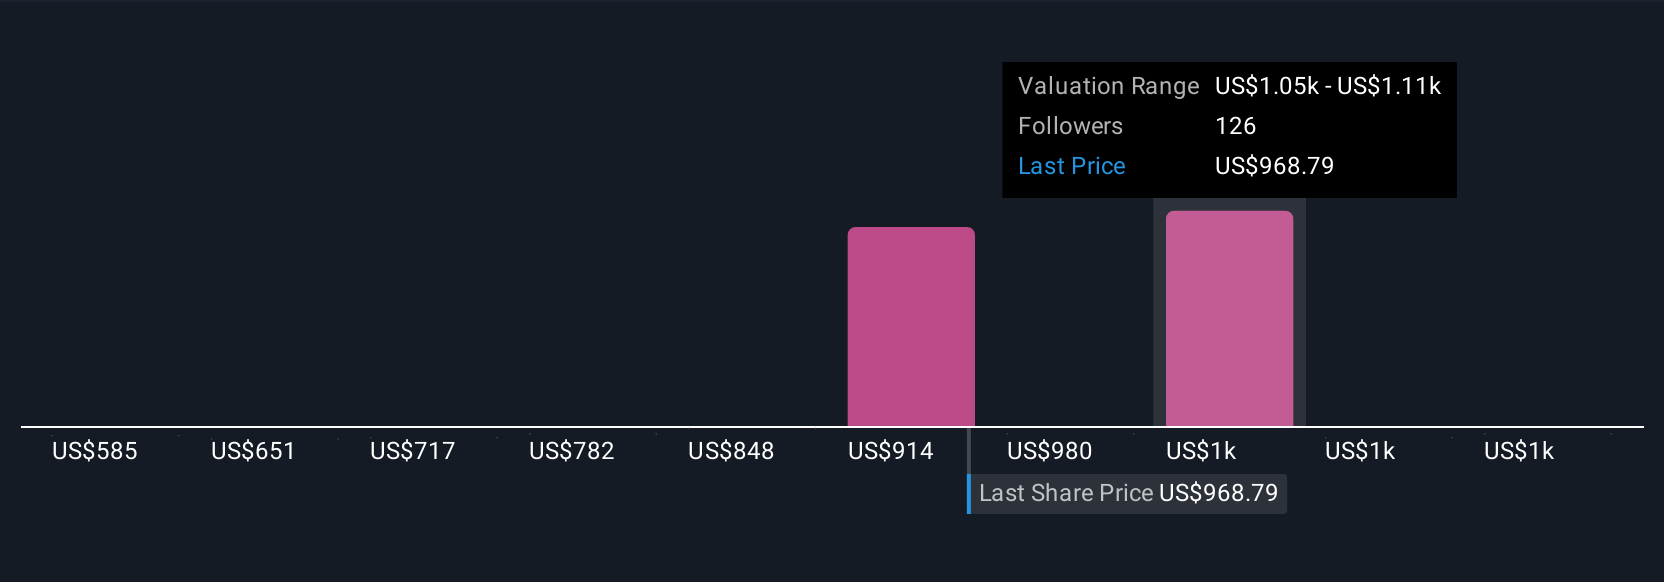
Earlier we mentioned that there is an even better way to understand valuation, so let us introduce Narratives, a simple way to connect your view of a company’s story with hard numbers like future revenue, earnings, margins and fair value. A Narrative on Simply Wall St’s Community page lets you spell out why you think ServiceNow will play out a certain way, translate that story into a forecast, and then see the fair value that logically follows from those assumptions. This makes buy or sell decisions more intuitive, because you can compare your Narrative’s fair value to today’s share price and decide whether the odds look in your favor. Narratives are also dynamic, automatically updating when fresh information comes in, such as earnings results, new AI partnerships or a proposed stock split, so your fair value view evolves with the facts. For ServiceNow, one investor might build a more cautious Narrative that leans toward a fair value near 904 dollars, while another might create a more optimistic Narrative closer to 1,243 dollars, and both can clearly see how their assumptions drive those very different outcomes.
Do you think there's more to the story for ServiceNow? Head over to our Community to see what others are saying!
This article by Simply Wall St is general in nature. We provide commentary based on historical data and analyst forecasts only using an unbiased methodology and our articles are not intended to be financial advice. It does not constitute a recommendation to buy or sell any stock, and does not take account of your objectives, or your financial situation. We aim to bring you long-term focused analysis driven by fundamental data. Note that our analysis may not factor in the latest price-sensitive company announcements or qualitative material. Simply Wall St has no position in any stocks mentioned.
Have feedback on this article? Concerned about the content? Get in touch with us directly. Alternatively, email editorial-team@simplywallst.com