
- PREMIUM
- LIVE QUOTES
 Index Options
 State Street
 CME Group
 Nasdaq
 Cboe
Cboe TradingView
 Wall Street Journal
Mitsui E&S (TSE:7003): Valuation Check After S&P Japan 500 Inclusion and a Powerful Share Price Run
MITSUI E&S (TSE:7003) just earned a spot in the S&P Japan 500, a shift that can pull the stock onto more institutional radars and naturally raise questions about what is already priced in.
See our latest analysis for MITSUI E&S.
That index inclusion comes after a powerful run, with the share price delivering a roughly 51 percent 3 month share price return and a striking 1 year total shareholder return above 330 percent, suggesting momentum is still building rather than fading.
If MITSUI E&S has you thinking about what else could be rerated next, it might be worth exploring fast growing stocks with high insider ownership for other fast moving opportunities backed by committed insiders.
But with MITSUI E&S now trading just below analyst price targets after a meteoric run, investors face a key question: is this still an undervalued industrial transformation story, or has the market already priced in years of growth?
Price to earnings of 26.3x, is it justified?
MITSUI E&S last closed at ¥6,351, and on that price the stock trades at a rich price to earnings ratio of 26.3 times, signalling a premium valuation rather than a bargain against peers.
The price to earnings ratio compares the company’s share price to its earnings per share, in effect showing how much investors are willing to pay today for each unit of current earnings. For a cyclical industrial group like MITSUI E&S, this multiple is often used as a shorthand for how strongly the market believes in the durability and growth of its future profit stream.
In this case, the 26.3 times price to earnings ratio stands noticeably above both the peer average of 12.1 times and the broader Japan machinery industry average of 12.5 times, suggesting the market is pricing in substantially higher profitability or growth than is typical for the sector. Even when compared with an estimated fair price to earnings ratio of 22.3 times derived from a fair ratio model, the current multiple still screens as expensive, hinting that sentiment may have run ahead of fundamentals and leaving less room for disappointment if earnings growth underwhelms.
Explore the SWS fair ratio for MITSUI E&S
Result: Price-to-earnings of 26.3x (OVERVALUED)
However, slower than expected revenue and earnings growth, combined with limited upside to analyst targets, could quickly challenge the lofty rerating narrative.
Find out about the key risks to this MITSUI E&S narrative.
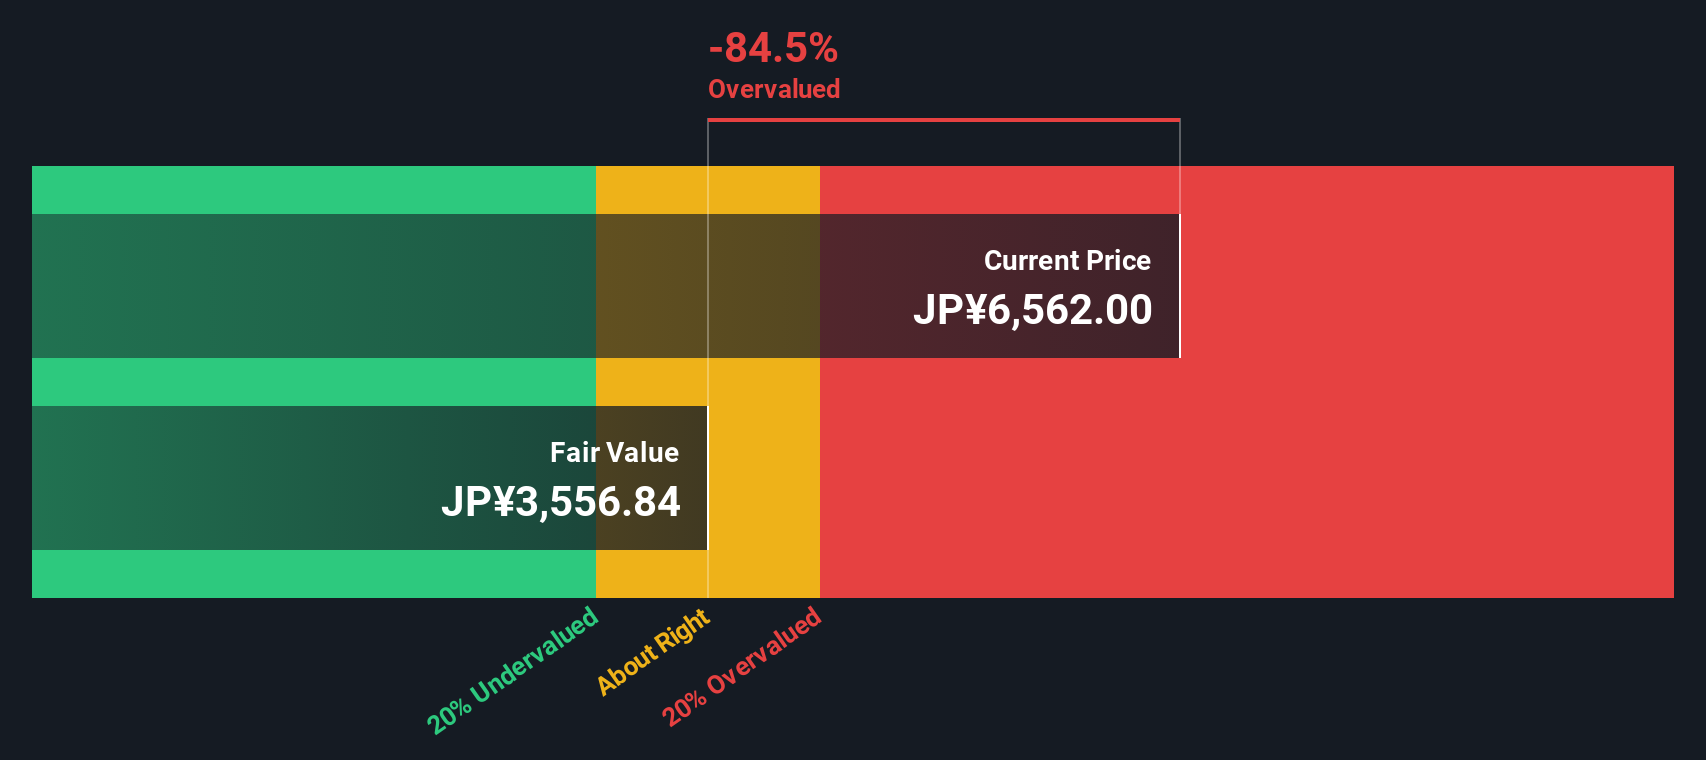
Another view from our DCF model
Our DCF model paints an even starker picture, with an estimated fair value of roughly ¥3,508 per share versus the current ¥6,351, implying the stock is trading well above intrinsic value. If both earnings multiples and cash flow point to overvaluation, what exactly is the market banking on?
Look into how the SWS DCF model arrives at its fair value.
Simply Wall St performs a discounted cash flow (DCF) on every stock in the world every day (check out MITSUI E&S for example). We show the entire calculation in full. You can track the result in your watchlist or portfolio and be alerted when this changes, or use our stock screener to discover 909 undervalued stocks based on their cash flows. If you save a screener we even alert you when new companies match - so you never miss a potential opportunity.
Build Your Own MITSUI E&S Narrative
If this perspective does not quite align with your own, or you would rather interrogate the numbers yourself, you can craft a tailored narrative in minutes: Do it your way.
A great starting point for your MITSUI E&S research is our analysis highlighting 1 key reward and 3 important warning signs that could impact your investment decision.
Looking for more investment ideas?
Do not stop with a single story. Use the Simply Wall Street Screener to uncover fresh opportunities that match your strategy before the market fully wakes up.
- Capture early momentum in smaller names by scanning these 3572 penny stocks with strong financials that pair higher risk with solid underlying financials.
- Position your portfolio for long term innovation trends by targeting these 30 healthcare AI stocks at the intersection of medicine, data, and automation.
- Strengthen your income stream by focusing on these 15 dividend stocks with yields > 3% that offer attractive yields with room for growth.
This article by Simply Wall St is general in nature. We provide commentary based on historical data and analyst forecasts only using an unbiased methodology and our articles are not intended to be financial advice. It does not constitute a recommendation to buy or sell any stock, and does not take account of your objectives, or your financial situation. We aim to bring you long-term focused analysis driven by fundamental data. Note that our analysis may not factor in the latest price-sensitive company announcements or qualitative material. Simply Wall St has no position in any stocks mentioned.
Have feedback on this article? Concerned about the content? Get in touch with us directly. Alternatively, email editorial-team@simplywallst.com