
- PREMIUM
- LIVE QUOTES
 Index Options
 State Street
 CME Group
 Nasdaq
 Cboe
Cboe TradingView
 Wall Street Journal
Has the 30% Slide in Zoetis Created a Compelling Value Opportunity in 2025?
- Wondering if Zoetis is quietly turning into a bargain after a rough stretch? You are not alone. This is exactly the moment when pricing and value can drift furthest apart.
- The stock has slid about 5.7% over the last week and 3.3% over the last month. It is now roughly 26.0% down year to date and 30.2% lower over the past year, which has reset expectations and brought valuation firmly into focus.
- Recently, the market has been reacting to shifting sentiment around the broader animal health space and changing views on how much investors are willing to pay for high quality defensiveness. In addition, ongoing debate about long term pet ownership trends and farm productivity investments has kept Zoetis in the spotlight as investors reassess what a fair multiple looks like.
- Despite that weak share price performance, Zoetis scores a strong 6/6 valuation check score, suggesting the recent pullback may have overshot the fundamentals. Next we will unpack the different valuation approaches investors are using today, before circling back at the end to an even more practical way to think about what the stock is really worth.
Find out why Zoetis's -30.2% return over the last year is lagging behind its peers.
Approach 1: Zoetis Discounted Cash Flow (DCF) Analysis
A Discounted Cash Flow model estimates what a business is worth today by projecting its future cash flows and then discounting those cash flows back to the present using a required rate of return.
For Zoetis, the model starts with last twelve month Free Cash Flow of about $2.2 billion and then projects how that figure could grow over time. Analysts provide detailed forecasts for the next few years, with Simply Wall St extending those projections out to 2035 using a 2 stage Free Cash Flow to Equity approach. By 2029, annual Free Cash Flow is expected to reach around $3.3 billion, with further gradual increases assumed thereafter.
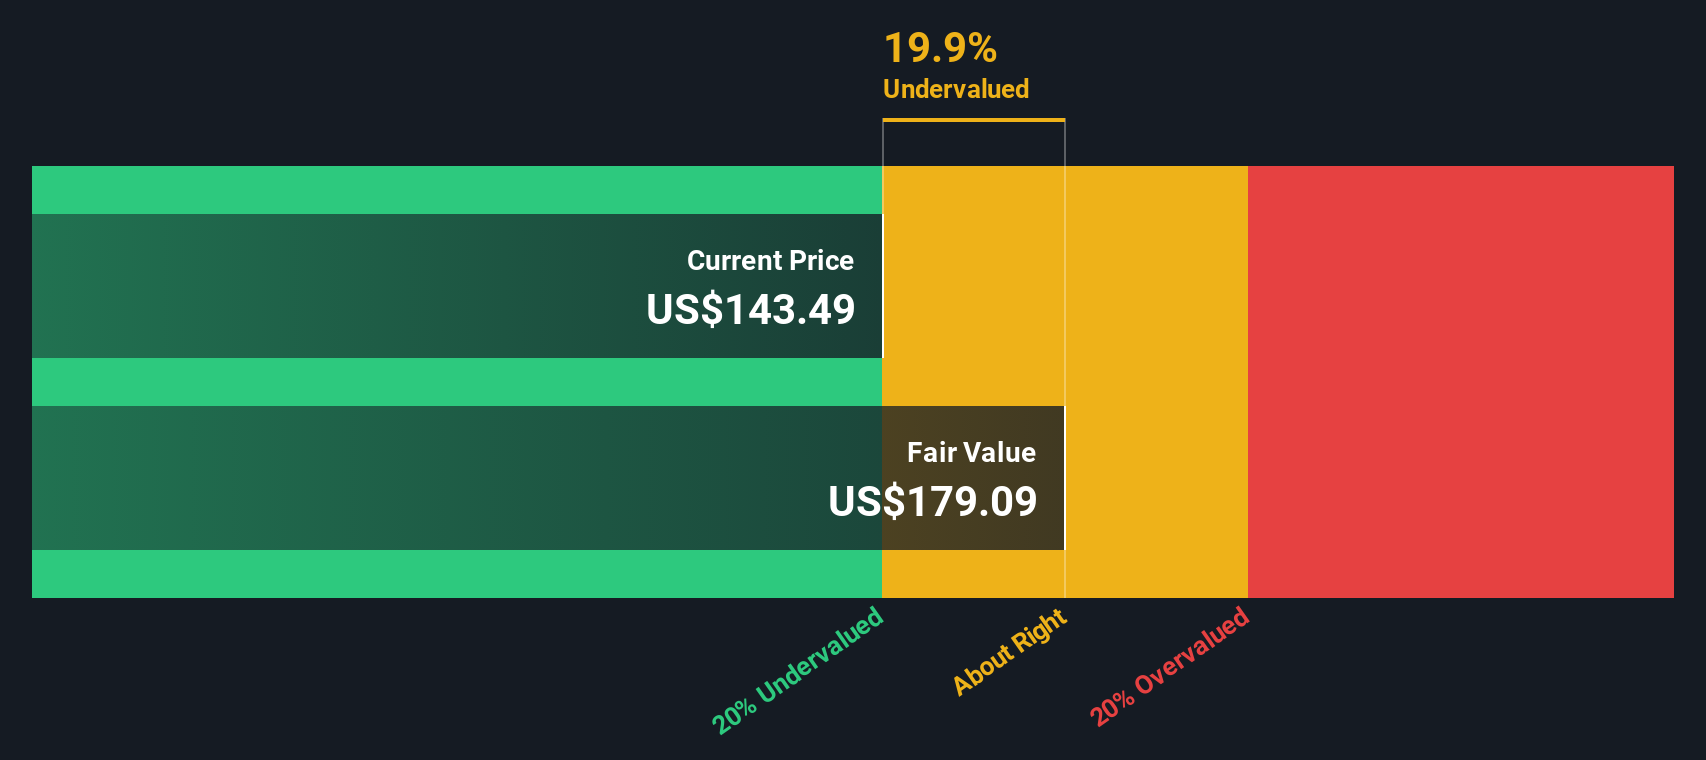
When all of those future $ cash flows are discounted back to today, the DCF model yields an intrinsic value of roughly $177.71 per share. Compared with the current share price, this implies Zoetis is trading at about a 32.3% discount to its estimated fair value, suggesting potential upside if the cash flow path plays out as expected.
Result: UNDERVALUED
Our Discounted Cash Flow (DCF) analysis suggests Zoetis is undervalued by 32.3%. Track this in your watchlist or portfolio, or discover 909 more undervalued stocks based on cash flows.
Approach 2: Zoetis Price vs Earnings
For profitable, established companies like Zoetis, the Price to Earnings ratio is often the go-to yardstick because it ties the share price directly to the earnings investors are ultimately paying for. What counts as a normal or fair PE, however, depends heavily on how fast earnings are expected to grow and how risky those earnings are perceived to be. Faster, more predictable growth usually deserves a higher multiple.
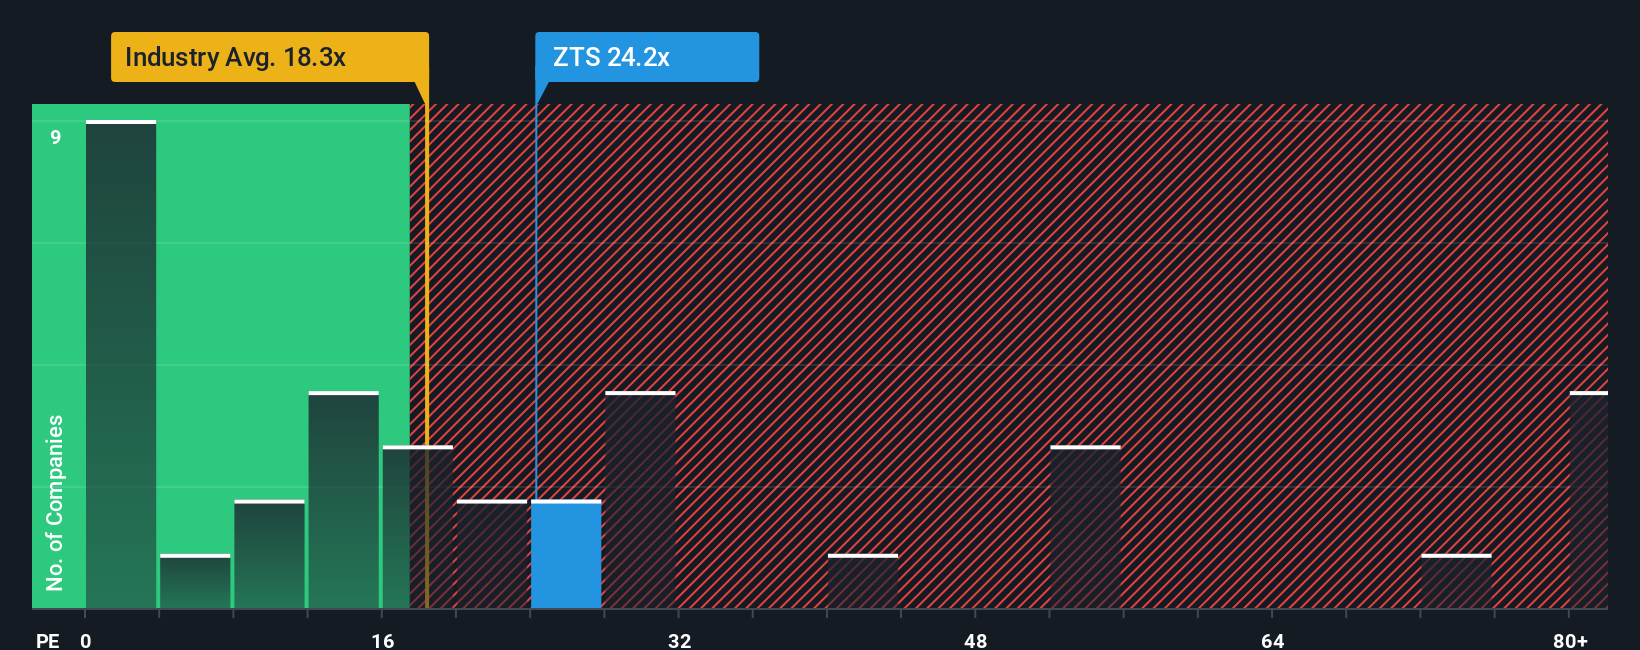
Zoetis currently trades on about 20.0x earnings, which is roughly in line with the broader Pharmaceuticals industry at around 20.0x, but sits at a notable discount to its direct peer group, which averages close to 25.0x. To refine that comparison, Simply Wall St calculates a Fair Ratio, a proprietary PE estimate of about 24.7x that reflects Zoetis specific earnings growth outlook, profitability, industry, market cap and risk profile.
This Fair Ratio is more informative than a simple peer or industry check because it blends company level drivers like margins, growth and risk with the broader context of the sector and size. Set against that 24.7x Fair Ratio, Zoetis 20.0x PE suggests the shares are trading below what would normally be expected for a business of this quality and outlook.
Result: UNDERVALUED
PE ratios tell one story, but what if the real opportunity lies elsewhere? Discover 1442 companies where insiders are betting big on explosive growth.
Upgrade Your Decision Making: Choose your Zoetis Narrative
Earlier we mentioned that there is an even better way to understand valuation. So let's introduce you to Narratives, a simple way to connect your view of Zoetis with the numbers behind its fair value. Narratives turn your expectations for future revenue, earnings and margins into a clear story that flows into a financial forecast and then into a fair value estimate.
On Simply Wall St's Community page, Narratives let millions of investors quickly build or adopt these story driven forecasts. They can compare the resulting fair value to the current share price to help decide how they feel about Zoetis, and then see those views update dynamically whenever new information such as earnings results, regulatory news or product updates comes in.
For Zoetis, for example, one investor might build a bullish Narrative that leans toward the higher end of current targets, closer to $230 per share, because they expect strong innovation, margin expansion and resilient pet demand. Another might choose a more cautious Narrative anchored nearer $153 per share, reflecting greater concern about competition and slower growth. Narratives make both perspectives transparent, structured and easy to track over time.
Do you think there's more to the story for Zoetis? Head over to our Community to see what others are saying!

This article by Simply Wall St is general in nature. We provide commentary based on historical data and analyst forecasts only using an unbiased methodology and our articles are not intended to be financial advice. It does not constitute a recommendation to buy or sell any stock, and does not take account of your objectives, or your financial situation. We aim to bring you long-term focused analysis driven by fundamental data. Note that our analysis may not factor in the latest price-sensitive company announcements or qualitative material. Simply Wall St has no position in any stocks mentioned.
Have feedback on this article? Concerned about the content? Get in touch with us directly. Alternatively, email editorial-team@simplywallst.com