
Is Grab Stock Offering Value After Recent Pullback and Mixed Valuation Signals in 2025?
- Wondering if Grab Holdings at around $5.30 is quietly setting up a value opportunity, or just another volatile tech name in Southeast Asia.
- The stock is up 11.8% year to date and 73.2% over three years, even after a recent 8.4% slide over the past month and a flat 1.1% gain over the last year. This hints at shifting market expectations rather than a clear uptrend.
- Recently, the spotlight has been on Grab's continued push to deepen its super app ecosystem across ride hailing, deliveries, and digital financial services, along with strategic moves to streamline operations and sharpen its path toward sustainable profitability. Together, these developments help explain why the market has at times rewarded the stock aggressively while also pulling back as investors reassess the balance of growth and risk.
- On our fundamental checks, Grab scores a 3/6 valuation score. This suggests pockets of undervaluation but not a clear-cut bargain yet. In the sections ahead we will unpack what different valuation methods say about that number, before closing with another way to think about the stock's true worth.
Find out why Grab Holdings's 1.1% return over the last year is lagging behind its peers.
Approach 1: Grab Holdings Discounted Cash Flow (DCF) Analysis
A Discounted Cash Flow model estimates what a company is worth today by projecting its future cash flows and discounting them back to the present. For Grab Holdings, the model uses a 2 Stage Free Cash Flow to Equity approach based on $140.99 Million in trailing twelve month free cash flow, then ramps this up using analyst forecasts and longer term growth assumptions.
Analysts expect free cash flow to reach about $656.28 Million by 2026 and $896 Million by 2027, with Simply Wall St extrapolating further to around $1.93 Billion by 2035 as growth gradually slows. When all those projected cash flows are discounted back, the model points to a fair value of roughly $7.45 per share.
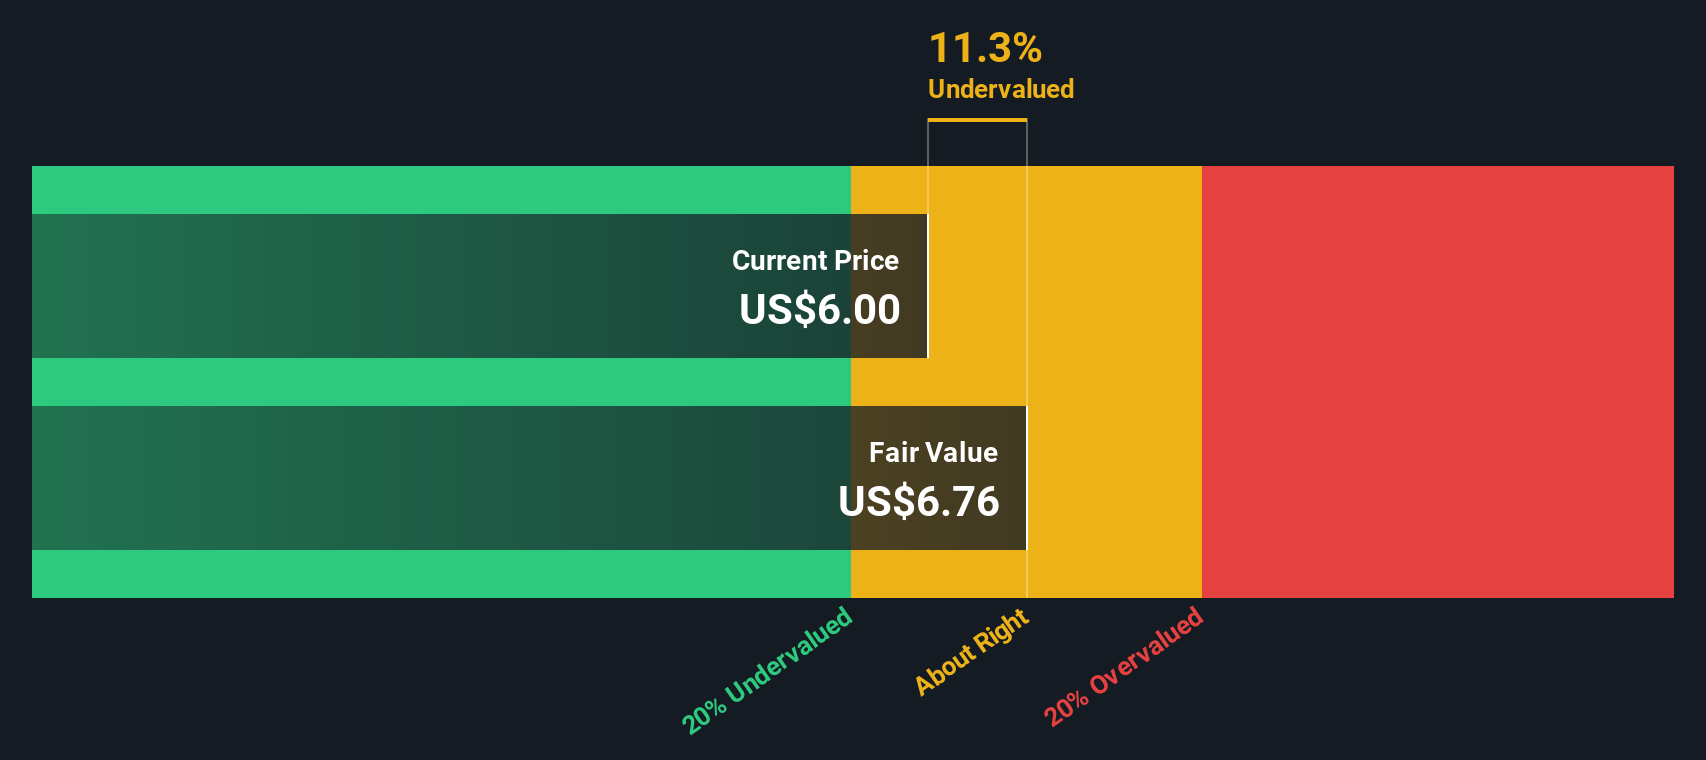
Compared with the current share price around $5.30, this implies Grab is trading at about a 28.9% discount to its estimated intrinsic value. This suggests the market is not fully pricing in its cash generation potential if the projections prove accurate.
Result: UNDERVALUED
Our Discounted Cash Flow (DCF) analysis suggests Grab Holdings is undervalued by 28.9%. Track this in your watchlist or portfolio, or discover 907 more undervalued stocks based on cash flows.
Approach 2: Grab Holdings Price vs Sales
For a business like Grab that is still building profitability but already generating substantial revenue, the price to sales ratio is often a more reliable yardstick than earnings based metrics. It focuses on how much investors are paying for each dollar of revenue, which is especially useful when margins are still evolving.
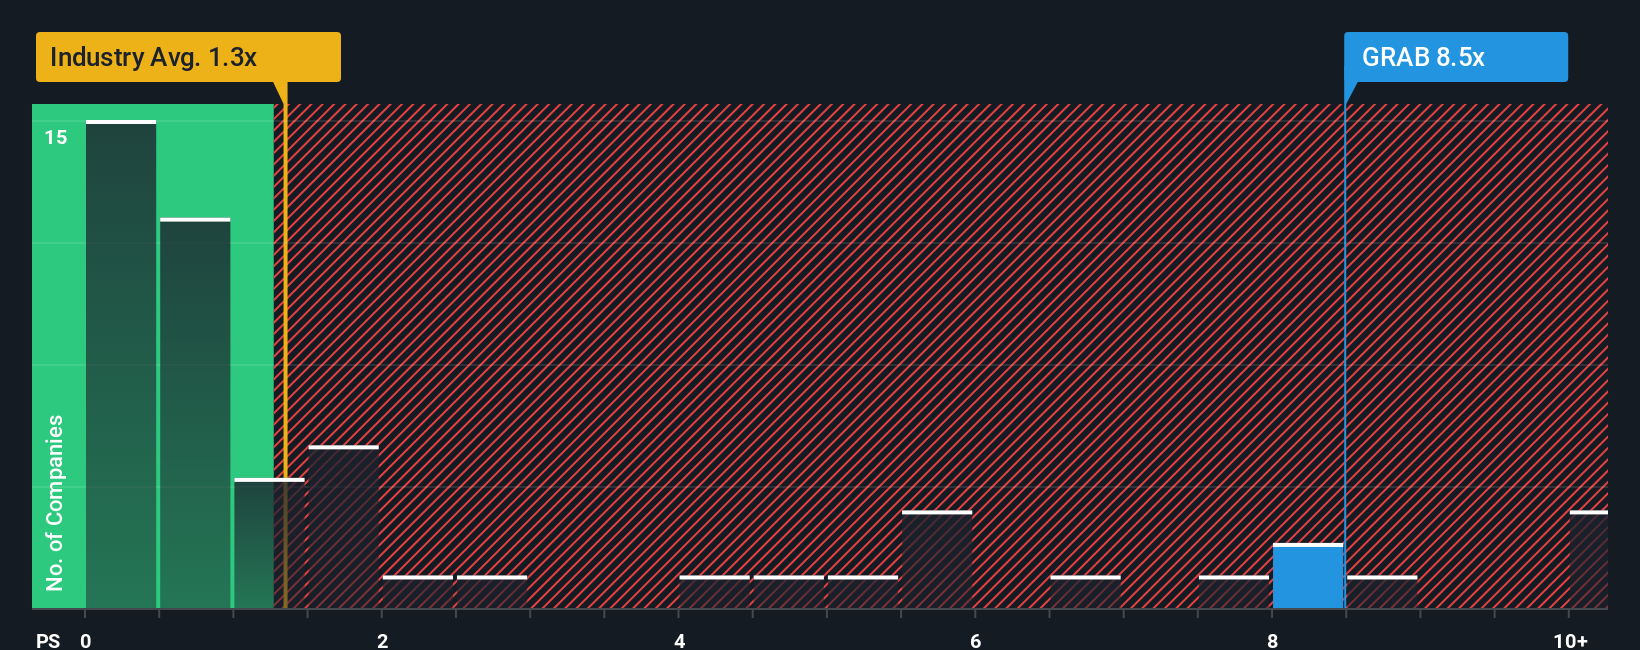
In general, higher growth and lower perceived risk can justify a richer sales multiple, while slower growth or higher risk should pull that multiple down. Grab currently trades on a price to sales ratio of 6.71x, well above both the Transportation industry average of 1.19x and the peer group average of 1.62x, which might initially make the stock look expensive on a simple relative basis.
However, Simply Wall St's Fair Ratio framework refines this comparison by estimating what a reasonable multiple should be, given Grab's specific growth outlook, profitability trajectory, risk profile, industry and size. On that basis, Grab's Fair Ratio is 2.87x, materially below its current 6.71x. This indicates that the market is paying a significant premium relative to the level implied by its fundamentals and risk adjusted characteristics.
Result: OVERVALUED
PS ratios tell one story, but what if the real opportunity lies elsewhere? Discover 1443 companies where insiders are betting big on explosive growth.
Upgrade Your Decision Making: Choose your Grab Holdings Narrative
Earlier we mentioned that there is an even better way to understand valuation, so let us introduce you to Narratives, which are simple stories investors create to connect their view of a company with concrete numbers like future revenue, earnings, margins and a resulting fair value. Investors then compare that to today’s price to decide whether to buy, hold or sell.
On Simply Wall St’s Community page, Narratives turn your perspective on Grab into a living forecast that is automatically updated when new information, such as earnings results or merger news, comes in. This helps you quickly see whether the gap between Fair Value and the current share price is widening or closing.
For example, one Grab Narrative might assume rapid fintech adoption, rising margins and a fair value above $8 per share. Another more cautious Narrative might focus on regulatory and competitive risks, assume slower growth and thinner margins, and land closer to $5, showing how two reasonable investors can look at the same company and reach very different but clearly quantified conclusions.
Do you think there's more to the story for Grab Holdings? Head over to our Community to see what others are saying!

This article by Simply Wall St is general in nature. We provide commentary based on historical data and analyst forecasts only using an unbiased methodology and our articles are not intended to be financial advice. It does not constitute a recommendation to buy or sell any stock, and does not take account of your objectives, or your financial situation. We aim to bring you long-term focused analysis driven by fundamental data. Note that our analysis may not factor in the latest price-sensitive company announcements or qualitative material. Simply Wall St has no position in any stocks mentioned.
Have feedback on this article? Concerned about the content? Get in touch with us directly. Alternatively, email editorial-team@simplywallst.com