
- PREMIUM
- LIVE QUOTES
 Index Options
 State Street
 CME Group
 Nasdaq
 Cboe
Cboe TradingView
 Wall Street Journal
Torrid Holdings (CURV) Q3 Loss and Margin Slippage Undercut Aggressive Earnings-Recovery Narrative
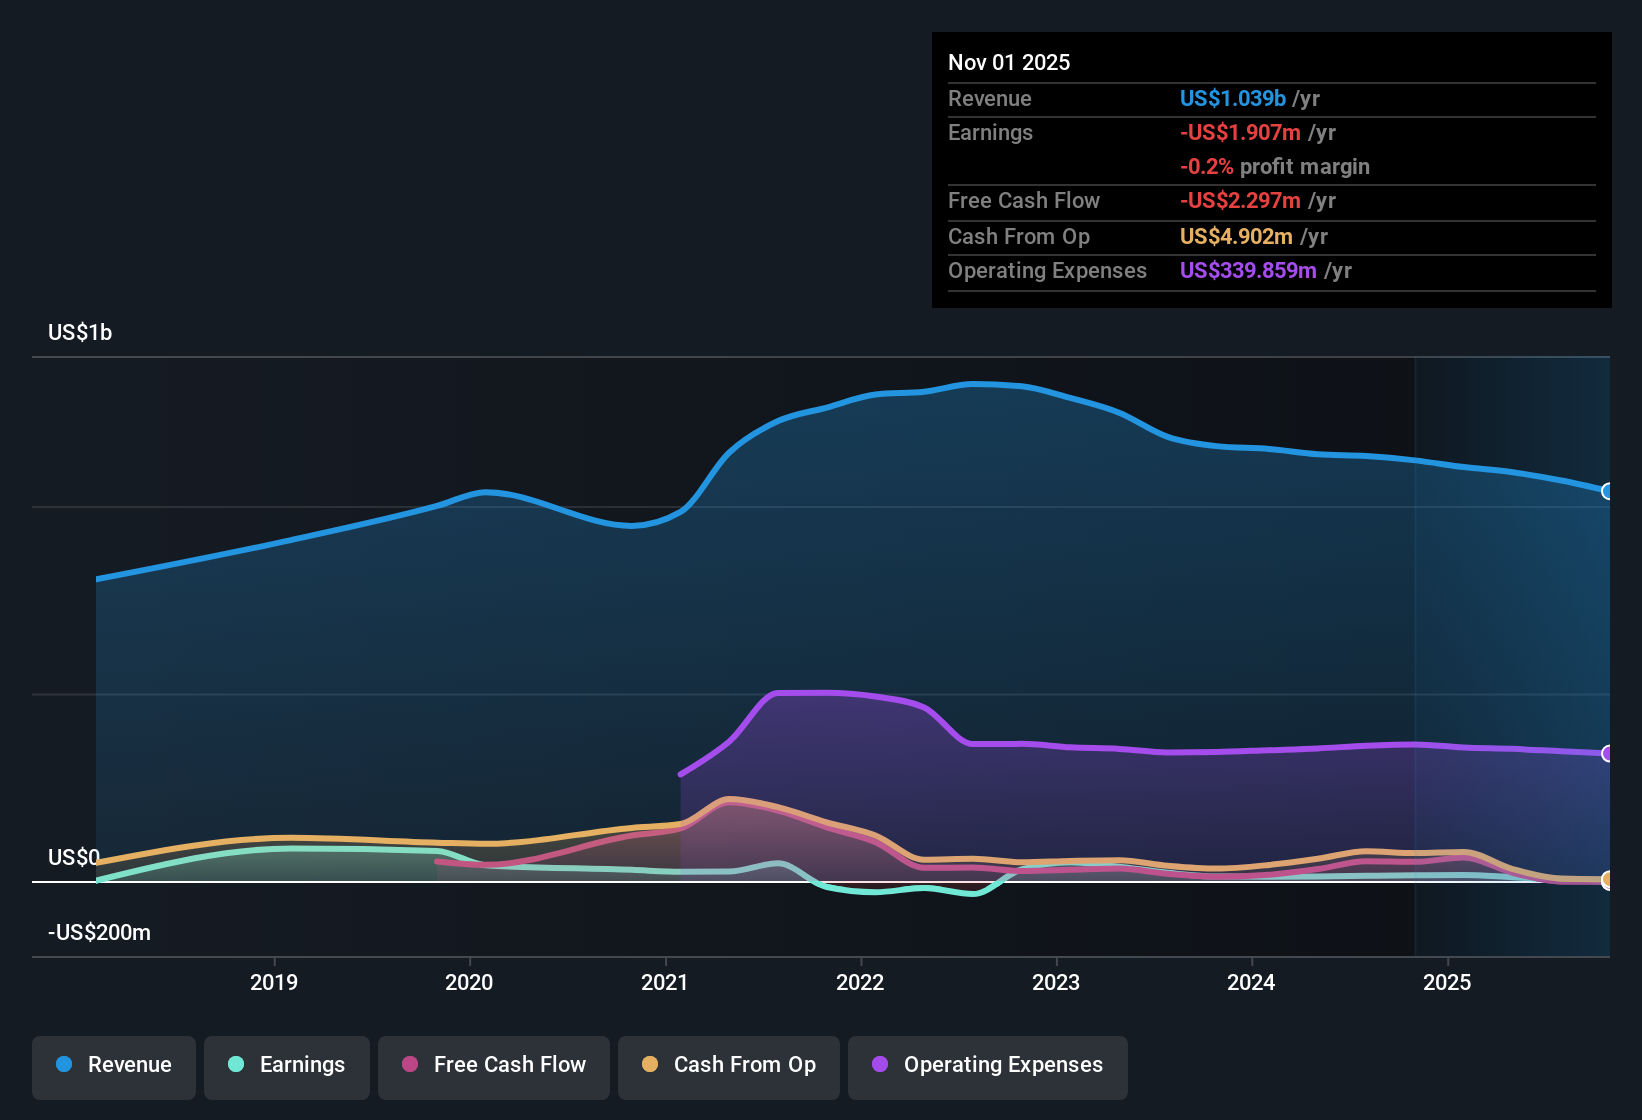
Torrid Holdings (CURV) just posted a softer Q3 2026 print, with revenue of about $235 million and a basic EPS loss of roughly $0.06, as net income came in at a loss of around $6.4 million. The company has seen quarterly revenue move from about $264 million in Q1 2026 to $263 million in Q3 2025 and now $235 million in Q3 2026, while EPS has swung from a profit of roughly $0.06 in Q1 and $0.02 in Q2 2026 to the current loss. This sets up an earnings season where the spotlight is firmly on whether margins can stabilize from here.
See our full analysis for Torrid Holdings.With the headline numbers on the table, the next step is to line them up against the prevailing narratives around Torrid's growth, profitability, and execution to see which stories still hold and which are starting to crack.
See what the community is saying about Torrid Holdings
Margins Slip as TTM Profit Turns Slightly Negative
- On a trailing twelve month basis, Torrid moved from $16.3 million of net income and 1.2% net margin in Q2 2025 to a small net loss of about $1.9 million and 0.3% margin by Q3 2026, even though revenue over that span only eased from roughly $1.13 billion to $1.04 billion.
- Bears argue that weak store performance and heavier promotions will keep pressuring margins, and the recent step down from $10.1 million TTM profit in Q1 2026 to a loss by Q3 2026 lends weight to that concern.
- The shift from positive quarterly net income of $5.9 million in Q1 2026 and $1.6 million in Q2 2026 to a $6.4 million loss in Q3 2026 lines up with worries about external cost pressures and rising marketing spend.
- With annualized earnings having declined around 2.4% per year over five years, the latest loss challenges the idea that margin pressure is just a short term bump.
Sales Drift While Earnings Forecasts Stay Aggressive
- Quarterly revenue has stepped down from about $284.6 million in Q2 2025 to $275.6 million in Q4 2025, then to $265.9 million, $262.8 million and now $235.2 million. At the same time, forecasts still call for earnings to grow roughly 76% per year even as revenue is expected to shrink around 4.3% annually over the next three years.
- Consensus narrative expects digital growth, sub brands and store closures to support profit expansion, but the combination of falling same store sales (down 4% to 7% across several recent quarters) and lower trailing revenue near $1.04 billion versus $1.13 billion a year earlier makes those aggressive earnings targets look demanding.
- Same store sales were negative in each disclosed quarter, including a 7% decline in both Q2 2026 and Q3 2025, which fits concerns about softer demand despite new value focused ranges.
- At the same time, analysts are assuming margins rise from about 0.3% to 2.4% over three years, so any continued revenue erosion could make that margin rebuild harder to achieve.
Stretched Balance Sheet Meets “Cheap on DCF” Story
- The shares trade at $1.13 versus a DCF fair value of about $1.28, and on roughly 39 times earnings compared with a peer average near 50 times and a broader US specialty retail average of about 18 times. The company also carries negative shareholders’ equity and weak interest coverage.
- Bulls point to cost cuts and digital mix as drivers of future upside, but the combination of thin 0.3% trailing margin, balance sheet risk from negative equity and interest costs not well covered by earnings means the valuation gap to DCF fair value looks closely tied to hitting those ambitious margin improvement targets.
- Forecast earnings growth of around 76% per year is central to the bullish case that today’s P E multiple will compress as profits catch up, yet the latest TTM numbers show only break even performance rather than clear momentum.
- With the stock only modestly below the stated DCF fair value and still priced above the broader industry multiple, any stumble in improving coverage of interest expense could quickly overshadow the perceived discount.
Next Steps
To see how these results tie into long-term growth, risks, and valuation, check out the full range of community narratives for Torrid Holdings on Simply Wall St. Add the company to your watchlist or portfolio so you'll be alerted when the story evolves.
See the numbers differently? Use that perspective to quickly build your own take on Torrid in just a few minutes with Do it your way.
A great starting point for your Torrid Holdings research is our analysis highlighting 2 key rewards and 5 important warning signs that could impact your investment decision.
Explore Alternatives
Torrid’s slipping margins, negative equity, and inconsistent sales leave little cushion for error and cast doubt on the ambitious earnings rebound story.
If those fragilities make you uneasy, use our solid balance sheet and fundamentals stocks screener (1940 results) today to quickly focus on businesses with stronger finances, healthier leverage, and balance sheets built to withstand tougher conditions.
This article by Simply Wall St is general in nature. We provide commentary based on historical data and analyst forecasts only using an unbiased methodology and our articles are not intended to be financial advice. It does not constitute a recommendation to buy or sell any stock, and does not take account of your objectives, or your financial situation. We aim to bring you long-term focused analysis driven by fundamental data. Note that our analysis may not factor in the latest price-sensitive company announcements or qualitative material. Simply Wall St has no position in any stocks mentioned.
Have feedback on this article? Concerned about the content? Get in touch with us directly. Alternatively, email editorial-team@simplywallst.com