
- PREMIUM
- LIVE QUOTES
 Index Options
 State Street
 CME Group
 Nasdaq
 Cboe
Cboe TradingView
 Wall Street Journal
Has the Recent 14.6% Rally Left Texas Instruments Priced for Perfection in 2025?
- Wondering if Texas Instruments is quietly turning into a value opportunity, or if the price has already run too far ahead of itself? Let us unpack whether TXN still makes sense at today's levels.
- After drifting for much of the year, the stock has popped recently, with shares up 10.4% over the last week and 14.6% over the past month, even though the year to date return is still slightly negative at -2.3%.
- That rebound has come as investors refocus on the long term power of analog and embedded chips in everything from industrial automation to autos, and as sentiment across the semiconductor space has improved. At the same time, commentary around reshoring, capacity expansion, and secular demand in power management has reminded the market that Texas Instruments is positioned at the heart of several durable trends.
- On our framework, Texas Instruments currently scores a 2 out of 6 on valuation checks. We will walk through what different valuation approaches say about the stock today, and then finish with a more intuitive way to think about what TXN is really worth in the long run.
Texas Instruments scores just 2/6 on our valuation checks. See what other red flags we found in the full valuation breakdown.
Approach 1: Texas Instruments Discounted Cash Flow (DCF) Analysis
A Discounted Cash Flow model estimates what a business is worth by projecting its future cash flows and then discounting them back to today, using a required rate of return.
For Texas Instruments, the latest twelve month free cash flow is about $2.0 Billion. Analysts and internal estimates expect this figure to grow meaningfully, with projections reaching roughly $9.0 Billion of free cash flow by 2029 and continuing to rise into the next decade as demand for analog and embedded chips expands.
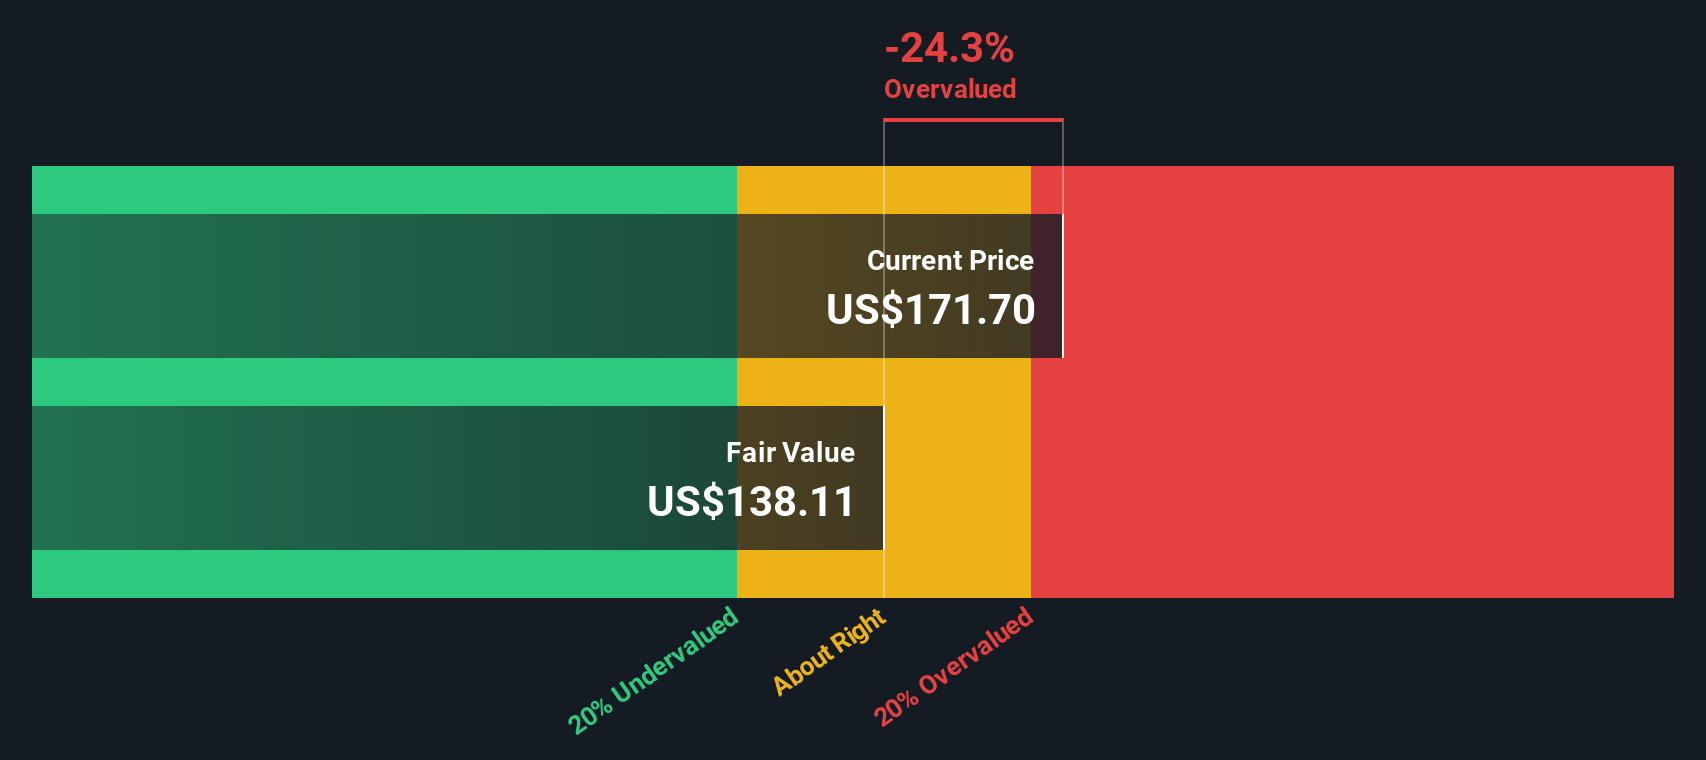
Simply Wall St uses a 2 Stage Free Cash Flow to Equity model, combining analyst forecasts for the next few years with extrapolated growth beyond that point. These cash flows are discounted to arrive at an intrinsic value of around $126.92 per share.
Compared with the current share price, this DCF output implies the stock is about 43.9% overvalued, suggesting that much of the expected long term cash generation is already priced in.
Result: OVERVALUED
Our Discounted Cash Flow (DCF) analysis suggests Texas Instruments may be overvalued by 43.9%. Discover 908 undervalued stocks or create your own screener to find better value opportunities.
Approach 2: Texas Instruments Price vs Earnings
For profitable, established companies like Texas Instruments, the price to earnings ratio is a straightforward way to gauge how much investors are willing to pay today for each dollar of current earnings. It naturally reflects both what the business is earning now and what the market expects those earnings to do over time.
In general, higher growth and lower perceived risk justify a higher PE ratio, while slower growth or greater uncertainty should translate into a lower, more conservative multiple. This makes it useful to compare TXN's PE to a few benchmarks to see whether expectations look stretched or reasonable.
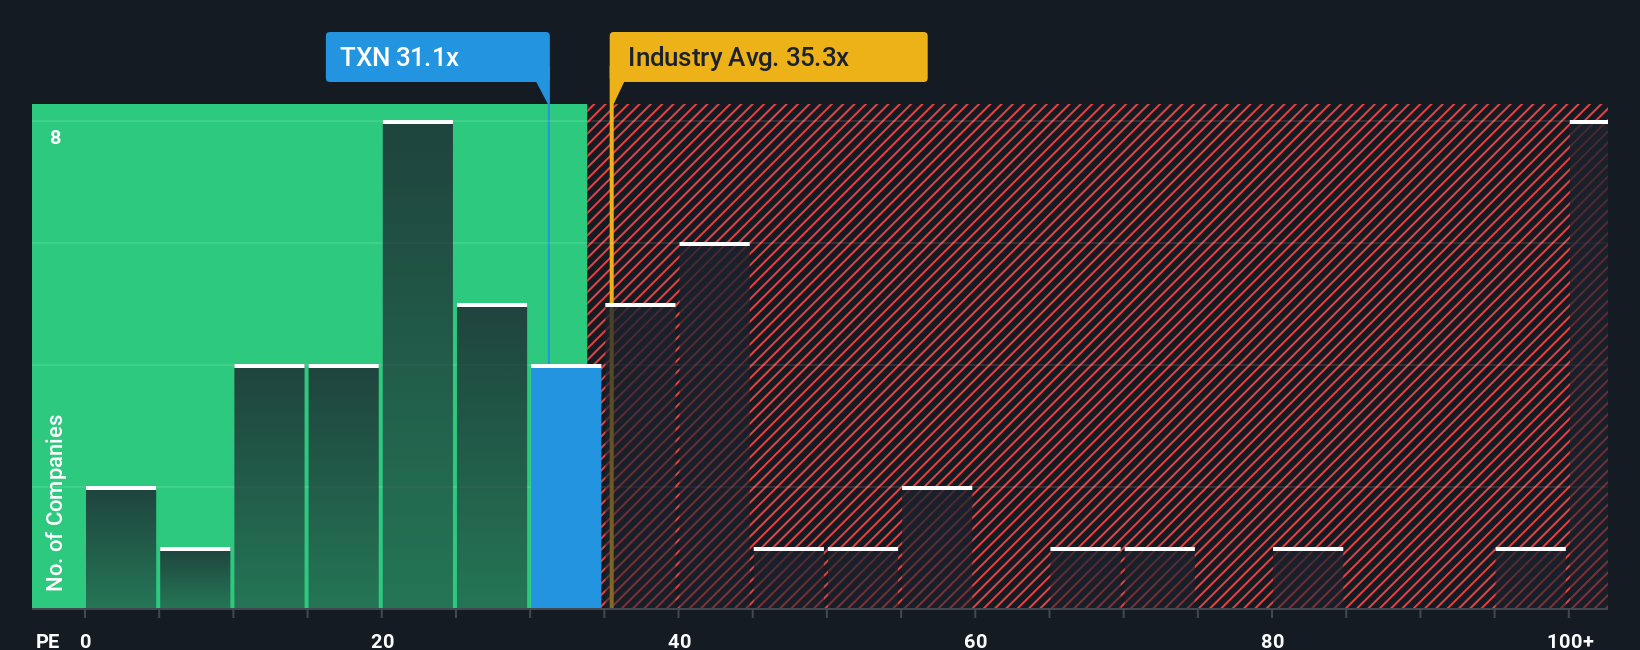
Texas Instruments currently trades on a PE of about 33.1x. That is below the Semiconductor industry average of roughly 37.6x, and well below the broader peer group average of around 75.6x, which includes some faster growing, higher risk names. Simply Wall St also calculates a proprietary Fair Ratio for each stock, which for TXN is 29.0x. The Fair Ratio is designed to be more precise than simple peer or industry comparisons because it incorporates the company’s own earnings growth outlook, risk profile, profit margins, industry and market cap.
Comparing TXN's current 33.1x PE to its 29.0x Fair Ratio suggests investors are paying a premium to its fundamentals and risk adjusted growth profile.
Result: OVERVALUED
PE ratios tell one story, but what if the real opportunity lies elsewhere? Discover 1442 companies where insiders are betting big on explosive growth.
Upgrade Your Decision Making: Choose your Texas Instruments Narrative
Earlier we mentioned that there is an even better way to understand valuation, so let us introduce you to Narratives, a simple way to connect your view of Texas Instruments' future with the numbers behind its fair value. A Narrative is the story you believe about a company, turned into concrete assumptions about future revenue, earnings and margins, which then flow through to a forecast and an estimated fair value. On Simply Wall St, Narratives are an easy tool within the Community page, where millions of investors capture their perspective on a stock and see how that translates into a buy or sell signal by comparing Fair Value to today’s Price. Because Narratives update dynamically as new news, earnings and guidance come in, they stay aligned with what is actually happening rather than a static one time model. For Texas Instruments, one Narrative might assume robust industrial automation and AI driven demand that supports a fair value closer to $260 per share, while a more cautious Narrative might focus on competition, tariffs and slower growth and arrive at something nearer $141, and your job is to decide which story feels more realistic.
For Texas Instruments, however, here are previews of two leading Texas Instruments Narratives:
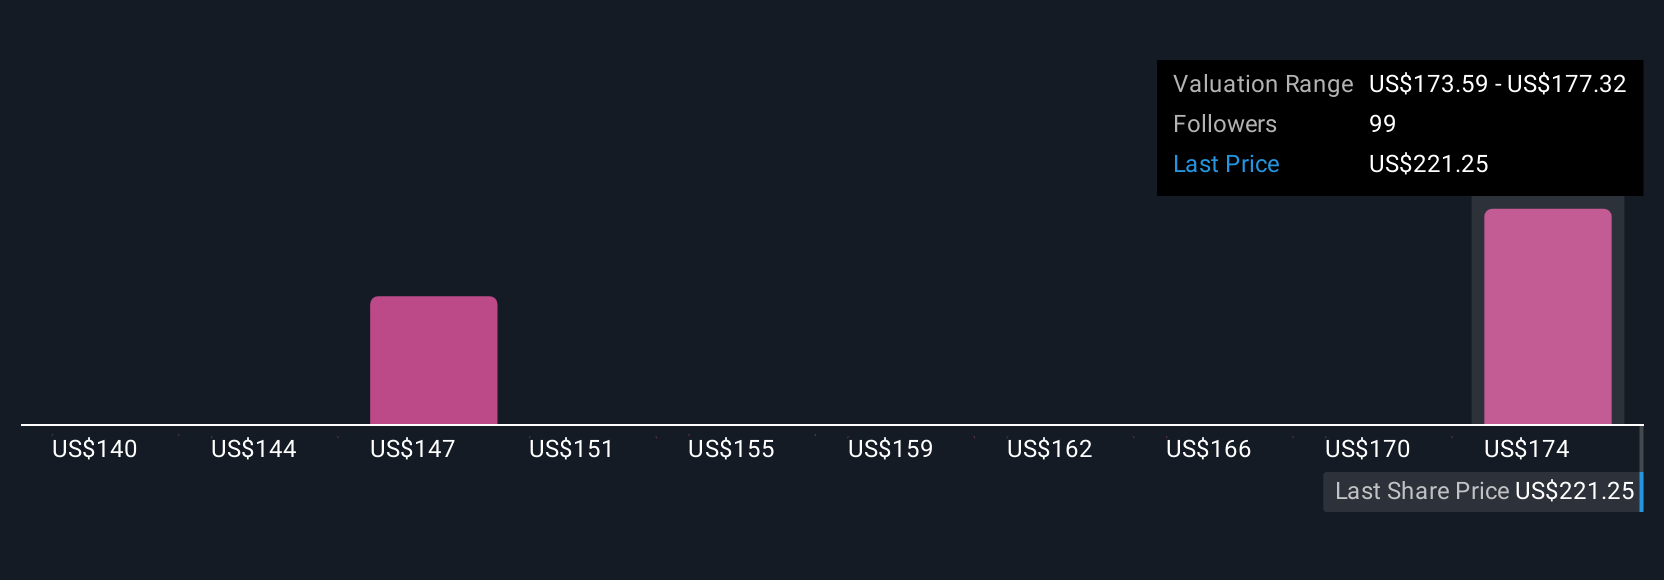
Fair value: $189.56 per share
Implied undervaluation vs last close: 3.7%
Forecast revenue growth: 9.43%
- Expects industrial automation and automotive demand to drive steady revenue growth and support high, resilient margins over time.
- Sees U.S. based manufacturing investments and tax incentives strengthening supply chain resilience, free cash flow, and capacity for dividends and buybacks.
- Views long life, high margin analog and embedded portfolios as a source of durable cash generation, even as competition and geopolitics remain key risks.
Fair value: $141.27 per share
Implied overvaluation vs last close: 29.2%
Forecast revenue growth: 6.54%
- Assumes maturing analog and embedded markets, rising competition, and regulatory friction will cap growth and pressure margins.
- Highlights risk that elevated capex, capacity additions, and tighter environmental rules could weigh on returns and free cash flow through the cycle.
- Argues that, even with improving fundamentals, today’s price embeds overly optimistic expectations that may not be met if growth normalizes.
Do you think there's more to the story for Texas Instruments? Head over to our Community to see what others are saying!
This article by Simply Wall St is general in nature. We provide commentary based on historical data and analyst forecasts only using an unbiased methodology and our articles are not intended to be financial advice. It does not constitute a recommendation to buy or sell any stock, and does not take account of your objectives, or your financial situation. We aim to bring you long-term focused analysis driven by fundamental data. Note that our analysis may not factor in the latest price-sensitive company announcements or qualitative material. Simply Wall St has no position in any stocks mentioned.
Have feedback on this article? Concerned about the content? Get in touch with us directly. Alternatively, email editorial-team@simplywallst.com