
- PREMIUM
- LIVE QUOTES
 Index Options
 State Street
 CME Group
 Nasdaq
 Cboe
Cboe TradingView
 Wall Street Journal
Does Brinker International Still Offer Value After Its 332.9% Surge?
- If you have been wondering whether Brinker International is still a bargain or if most of the upside is already priced in, you are not alone. This article is going to dig into that value question head on.
- After a powerful multi year run that has pushed the stock up 332.9% over 3 years and 165.5% over 5 years, the shares have cooled slightly with a 6.4% drop over the last week following a strong 35.2% gain in the past month.
- Much of the recent move has been driven by renewed optimism around casual dining traffic and menu pricing, as investors reassess how resilient household spending really is in this environment. At the same time, headlines around restaurant labor costs and shifting consumer preferences have kept a floor under perceived risk, creating a tug of war in the share price.
- Despite that back and forth, Brinker International currently scores a 5/6 on our valuation checks, suggesting it still screens as undervalued on most of the metrics we track. Next up, we will unpack the different valuation approaches behind that score and then circle back to a smarter, narrative driven way of thinking about value that can matter even more than the raw numbers.
Approach 1: Brinker International Discounted Cash Flow (DCF) Analysis
The Discounted Cash Flow model projects a company’s future cash flows and then discounts them back to today’s dollars, aiming to estimate what the business is worth right now.
For Brinker International, the latest twelve month Free Cash Flow stands at about $478.9 million. Using analyst estimates and then extending those trends further out, our 2 Stage Free Cash Flow to Equity model projects Free Cash Flow growing to roughly $704.9 million by 2035. The early years are anchored in analyst forecasts, while the later years are extrapolated based on a gradually slowing growth profile, reflecting a maturing business rather than perpetual high growth.
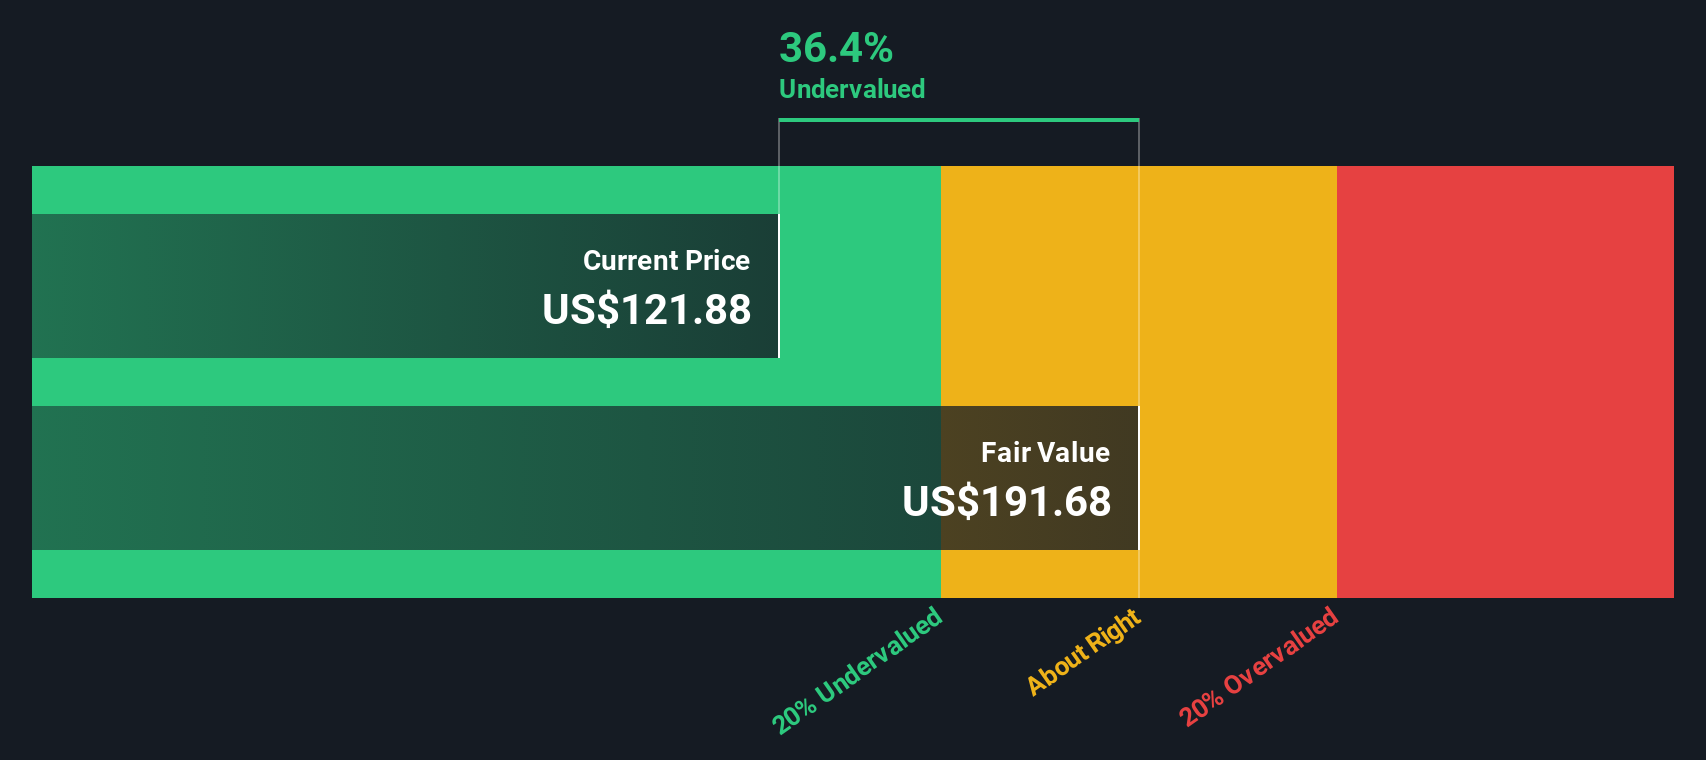
When these future cash flows are discounted back to today, the model arrives at an intrinsic value of about $203.33 per share. Compared to the current market price, this suggests the stock trades at roughly a 30.1% discount, indicating that investors are paying significantly less than what the projected cash flows suggest is reasonable.
Result: UNDERVALUED
Our Discounted Cash Flow (DCF) analysis suggests Brinker International is undervalued by 30.1%. Track this in your watchlist or portfolio, or discover 912 more undervalued stocks based on cash flows.
Approach 2: Brinker International Price vs Earnings
The price to earnings ratio is a natural fit for valuing a consistently profitable company like Brinker International, because it directly links what investors are paying for each dollar of current earnings. In general, companies with stronger, more reliable growth and lower perceived risk deserve a higher PE ratio, while slower growing or riskier businesses tend to trade on lower multiples.
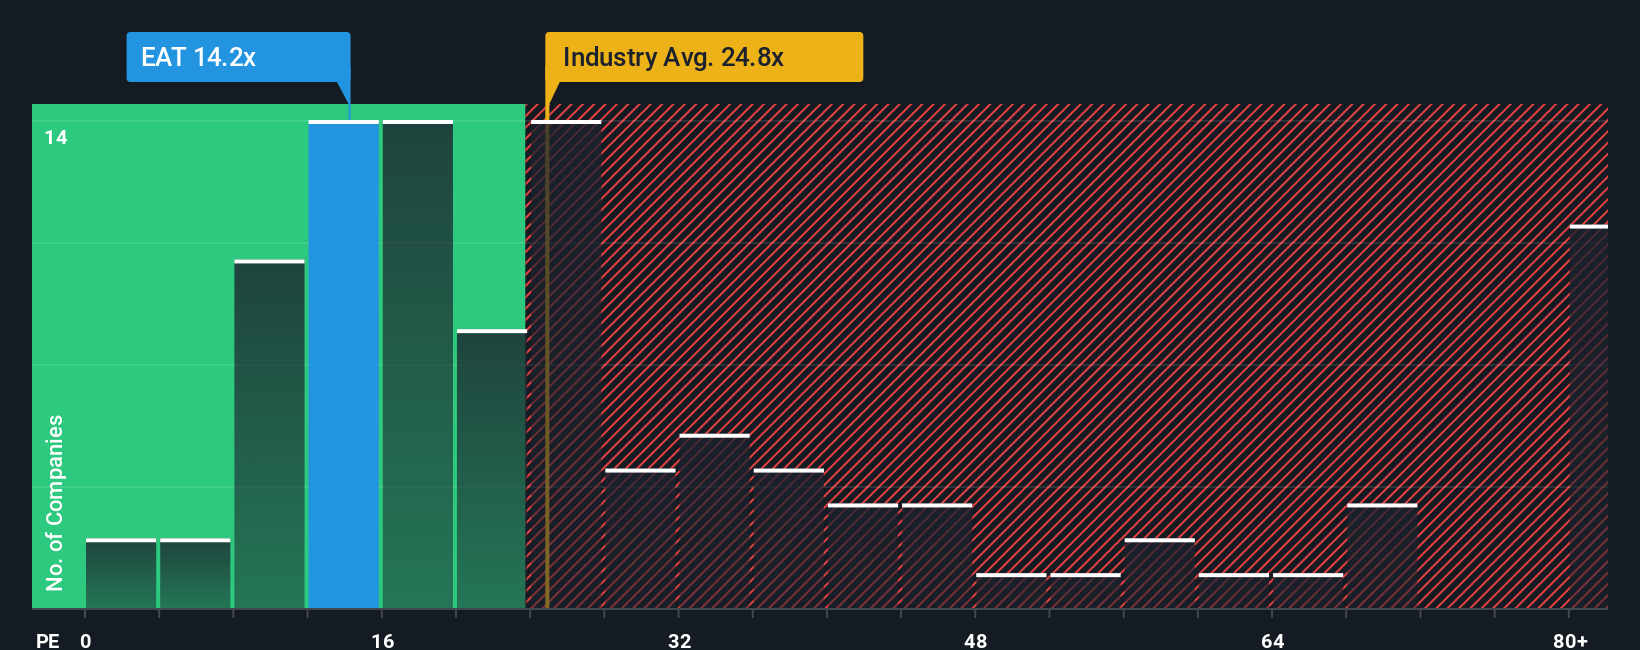
Brinker currently trades on a PE of about 14.2x, which is below both the Hospitality industry average of roughly 21.2x and the broader peer group average near 36.2x. Simply Wall St also calculates a Fair Ratio of around 19.1x, which is the PE you might expect given Brinker’s earnings growth outlook, margins, size and risk profile. This Fair Ratio is more tailored than a simple comparison to peers or the industry, because it adjusts for the company’s specific fundamentals rather than assuming all restaurant stocks deserve the same multiple. When compared to that 19.1x Fair Ratio, the current 14.2x valuation suggests the market is still applying a meaningful discount to Brinker’s earnings power.
Result: UNDERVALUED
PE ratios tell one story, but what if the real opportunity lies elsewhere? Discover 1443 companies where insiders are betting big on explosive growth.
Upgrade Your Decision Making: Choose your Brinker International Narrative
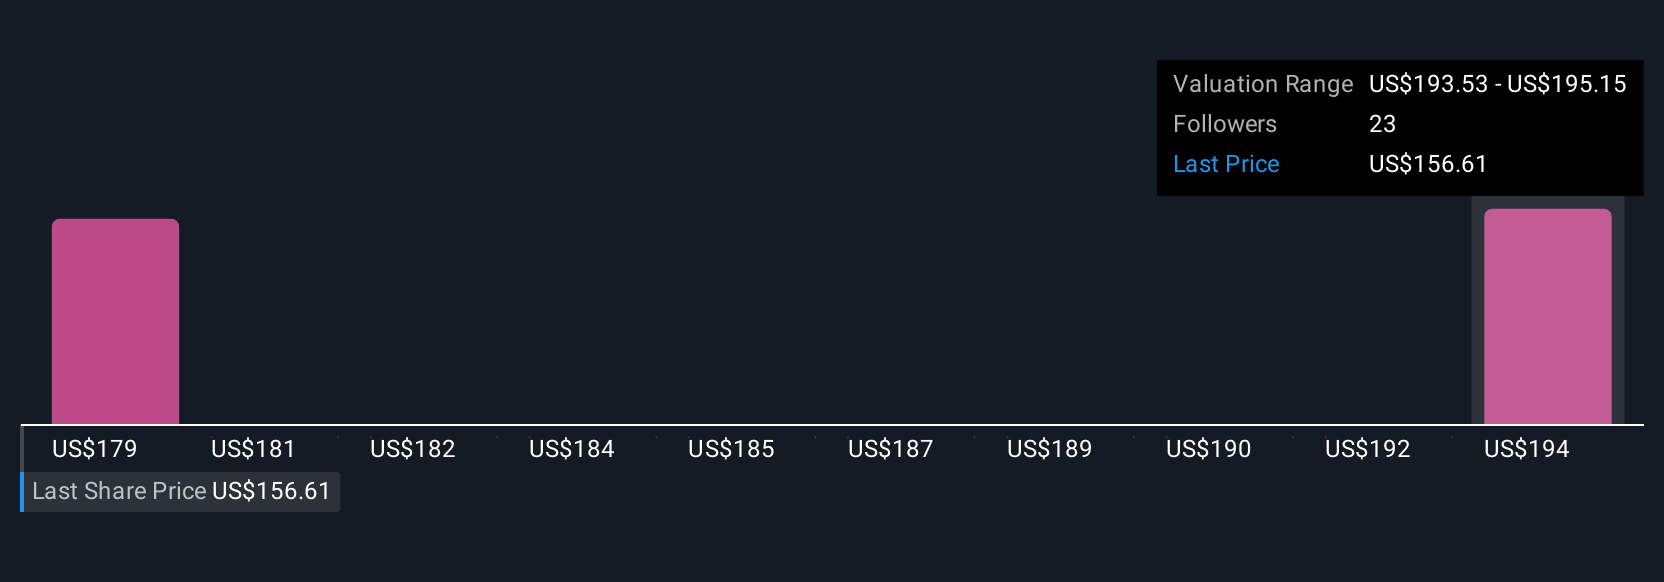
Earlier we mentioned that there is an even better way to understand valuation, so let us introduce you to Narratives, which are simple stories you create about a company that connect your view of its future revenue, earnings and margins to a financial forecast and, ultimately, to a fair value estimate. On Simply Wall St’s Community page, used by millions of investors, Narratives make this process easy by letting you plug in your assumptions and immediately see how your story translates into a Fair Value that you can compare with the current share price to help inform your decisions. These Narratives are dynamic, updating automatically when new information like earnings, news or guidance arrives, so your fair value view stays in sync with reality instead of going stale. For Brinker International, for example, one investor might build a bullish Narrative around sustained menu innovation, digital growth and margin expansion that supports a fair value closer to the optimistic 215 dollar target, while another might focus on dine in risk, labor inflation and health trends, arriving at a more cautious view nearer the 160 dollar end of the range.
Do you think there's more to the story for Brinker International? Head over to our Community to see what others are saying!
This article by Simply Wall St is general in nature. We provide commentary based on historical data and analyst forecasts only using an unbiased methodology and our articles are not intended to be financial advice. It does not constitute a recommendation to buy or sell any stock, and does not take account of your objectives, or your financial situation. We aim to bring you long-term focused analysis driven by fundamental data. Note that our analysis may not factor in the latest price-sensitive company announcements or qualitative material. Simply Wall St has no position in any stocks mentioned.
Have feedback on this article? Concerned about the content? Get in touch with us directly. Alternatively, email editorial-team@simplywallst.com