
- PREMIUM
- LIVE QUOTES
 Index Options
 State Street
 CME Group
 Nasdaq
 Cboe
Cboe TradingView
 Wall Street Journal
Assessing I.D.I. Insurance (TASE:IDIN) Valuation After Its Mixed Q3 2025 Earnings Update
I.D.I. Insurance (TASE:IDIN) just released mixed Q3 and nine month 2025 numbers, with quarterly profit easing slightly while year to date earnings climbed, and a fresh cash dividend now available to shareholders.
See our latest analysis for I.D.I. Insurance.
The mixed earnings picture and fresh dividend seem to be keeping sentiment constructive, with a 1 month share price return of 21.52 percent feeding into an 86.19 percent year to date share price gain and a 97.47 percent 1 year total shareholder return. This indicates that momentum remains clearly positive.
If these results have you rethinking what else belongs on your radar, it could be a good moment to explore fast growing stocks with high insider ownership for more potential standouts.
With the share price near record highs and profits advancing over nine months but slipping in the latest quarter, the key question now is whether I.D.I. Insurance still offers upside, or if the market already anticipates its future growth.
Price-to-Earnings of 11.3x: Is it justified?
I.D.I. Insurance shares last closed at ₪240, and the stock trades on a price to earnings ratio of 11.3 times recent earnings, pointing to a valuation that is modest versus the broader Israeli market but not cheap against direct insurance peers.
The price to earnings ratio compares what investors pay per share to the company’s earnings per share, making it a straightforward way to judge how highly the market is rating current profits. For an insurer like I.D.I. Insurance, with established operations across general, health, and life lines, the P E multiple is a key gauge of how the market is pricing in the durability and growth of those earnings.
On one hand, the stock looks inexpensive versus the IL market average multiple of 15.3 times. This suggests investors are not paying a market premium for each shekel of earnings despite the company posting high return on equity and improving profit margins. On the other hand, it screens a little expensive relative to the wider Asian insurance industry multiple of 10.9 times. This implies the market is assigning I.D.I. Insurance a slight premium to regional peers, potentially reflecting its faster recent profit growth and perceived earnings quality. Compared with its immediate peer set, the 11.3 times multiple actually sits below the 12.6 times peer average, which underlines that while the stock is not a deep value outlier, its pricing is not stretched versus similar companies.
See what the numbers say about this price — find out in our valuation breakdown.
Result: Price-to-Earnings of 11.3x (ABOUT RIGHT)
However, there are still risks, including competitive pricing pressure in core motor lines and any regulatory shift that reduces margins or capital flexibility.
Find out about the key risks to this I.D.I. Insurance narrative.
Another Way to Look at Value
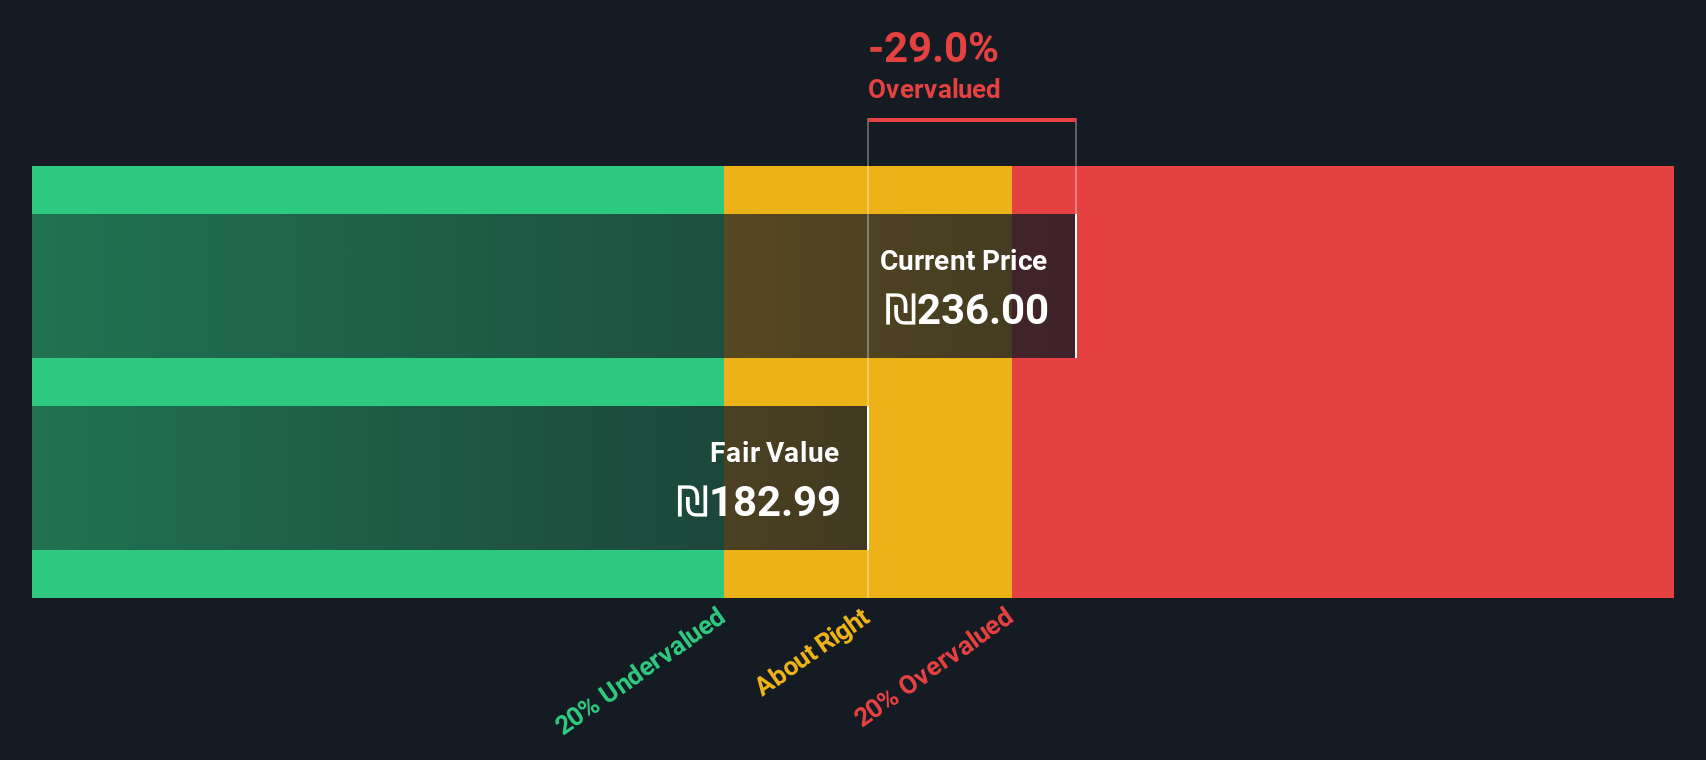
While the 11.3 times earnings multiple suggests I.D.I. Insurance is roughly fairly priced, our DCF model paints a tougher picture. With shares at ₪240 versus an estimated fair value of about ₪183, the stock screens as notably overvalued, which raises the question of how long momentum can outrun fundamentals.
Look into how the SWS DCF model arrives at its fair value.
Simply Wall St performs a discounted cash flow (DCF) on every stock in the world every day (check out I.D.I. Insurance for example). We show the entire calculation in full. You can track the result in your watchlist or portfolio and be alerted when this changes, or use our stock screener to discover 916 undervalued stocks based on their cash flows. If you save a screener we even alert you when new companies match - so you never miss a potential opportunity.
Build Your Own I.D.I. Insurance Narrative
If you see the numbers differently, or simply prefer hands on research, you can build a personalised view of I.D.I. Insurance in just minutes: Do it your way.
A great starting point for your I.D.I. Insurance research is our analysis highlighting 2 key rewards and 2 important warning signs that could impact your investment decision.
Ready for more investment ideas?
Before you move on, you could look for your next opportunity by using the Simply Wall Street Screener to find stocks that closely match your strategy.
- Explore potential bargains that the market may be overlooking by scanning these 916 undervalued stocks based on cash flows and focus your attention on areas where you see the most potential.
- Look into breakthroughs in medicine by reviewing companies at the intersection of healthcare and AI with these 30 healthcare AI stocks before they become more widely followed.
- Analyze the growth and volatility of digital assets in the stock market by filtering for businesses with exposure to blockchain innovation via these 81 cryptocurrency and blockchain stocks.
This article by Simply Wall St is general in nature. We provide commentary based on historical data and analyst forecasts only using an unbiased methodology and our articles are not intended to be financial advice. It does not constitute a recommendation to buy or sell any stock, and does not take account of your objectives, or your financial situation. We aim to bring you long-term focused analysis driven by fundamental data. Note that our analysis may not factor in the latest price-sensitive company announcements or qualitative material. Simply Wall St has no position in any stocks mentioned.
Have feedback on this article? Concerned about the content? Get in touch with us directly. Alternatively, email editorial-team@simplywallst.com