
- PREMIUM
- LIVE QUOTES
 Index Options
 State Street
 CME Group
 Nasdaq
 Cboe
Cboe TradingView
 Wall Street Journal
The DeCarley Perspective...Investors Practicing Crowd Investing: A Deep Dive into Positioning
Investors Practicing Crowd Investing: A Deep Dive into Positioning
Bandwagon investing is nothing new. Groupthink mentality has been driving markets since the Dutch Tulip Mania in the early 1600s. While that was probably the first recorded price bubble, it wasn’t the last, and as time goes on, market bubbles have become increasingly more global. In other words, the Dutch tulip market frenzy was confined to a relatively small area of the globe; it likely didn’t extend beyond the Dutch border. Further, the damage was mostly limited to a small group of wealthy merchants and speculators rather than the masses. 400 years later, humans are behaving just as they did during the Tulip run, but this time we have social media, widespread streaming news sources, and global market access. Not only has technology greased the wheels for asset bubbles, but it has also, arguably, allowed them to persist for longer and to wreak havoc on the price discovery of a plethora of assets simultaneously, rather than targeting a single asset for investment dollars.
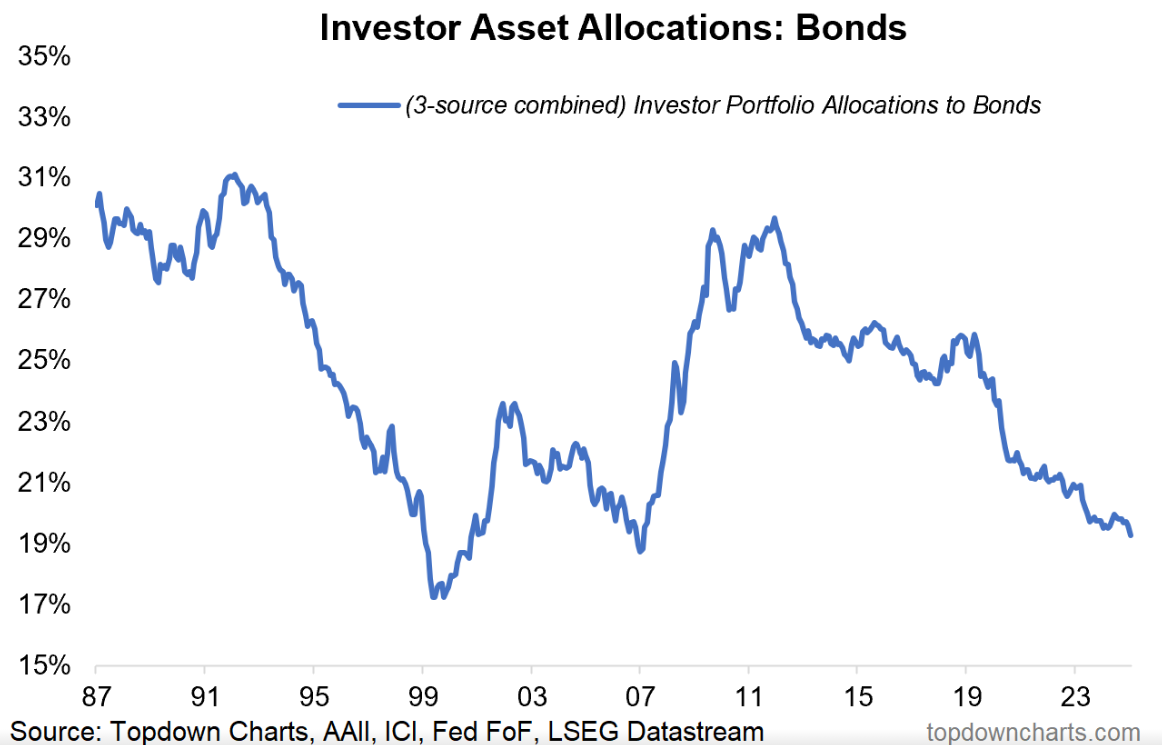
Today, investors are chasing risk and returns; we know this because many of them are avoiding standard diversification into fixed income. When everyone is flocking to stocks, select commodities (metals), and even alternative assets such as crypto, it might or might not be a negative endorsement for US debt, but it is certainly an indication of risk-hungry crowd behavior. Crowds don’t necessarily care about fundamentals; they care about momentum. That momentum has been in favor of risk takers and in contrast to risk-averse portfolios. According to data available to us, it appears that investor portfolios are holding the fewest bonds in about 20 years. This is important because the last two occasions when bond allocations were extremely low (2000 and 2007) were, in hindsight, harbingers of bear markets in stocks (thanks to Callum Thomas of Topdown Charts for the image).
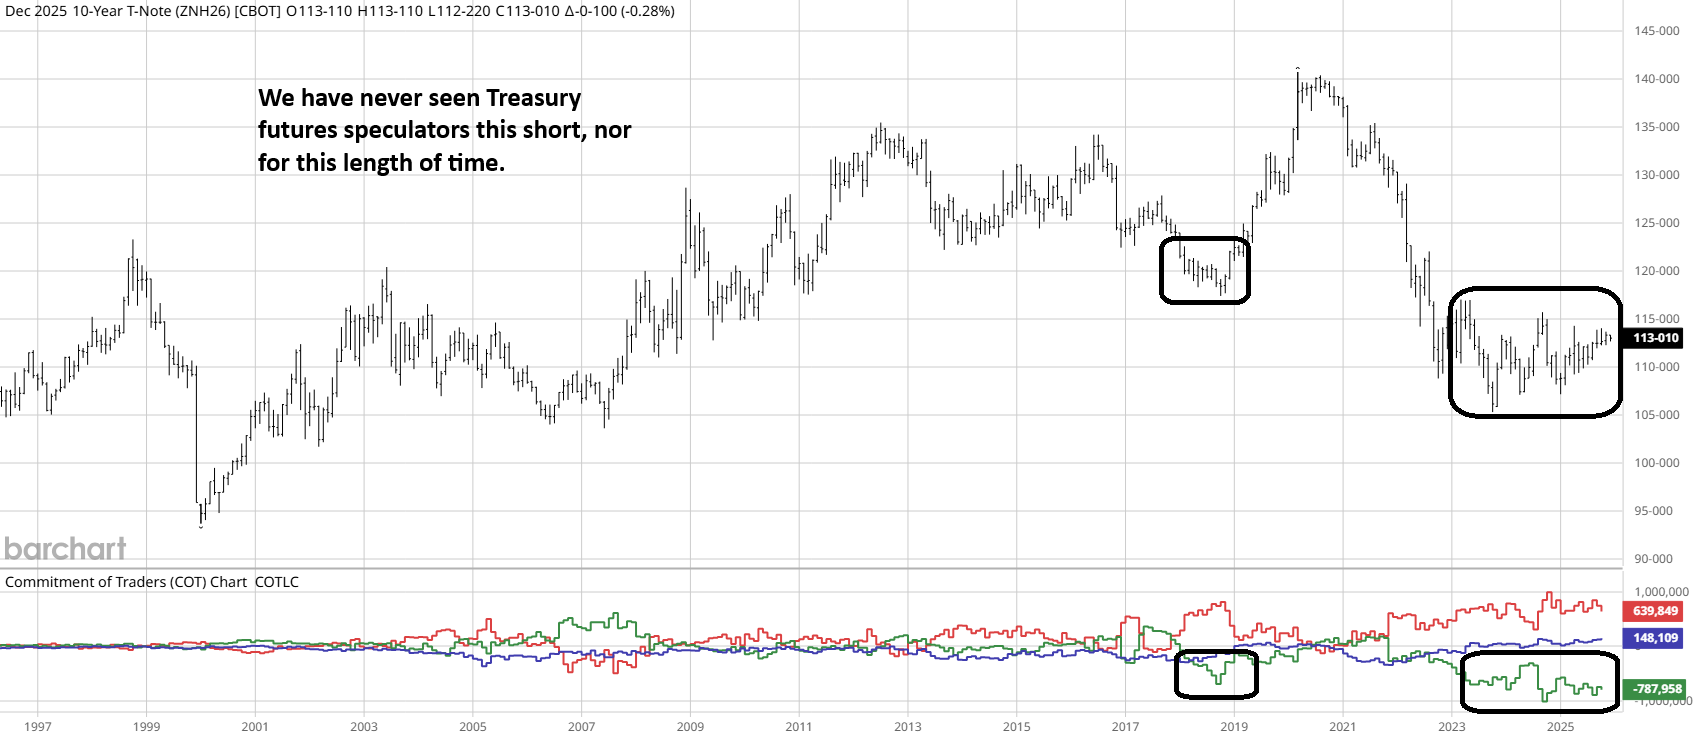
One explanation for this is position saturation. When risk assets are the most popular and bonds are the least popular, it suggests everyone is positioned in the same direction. If we look under the hood, we can confirm as much. For full disclosure, we will be analyzing the Commodity Futures Trading Commission’s (CFTC) Commitments of Traders (COT) report, which has not been reported since October due to the government shutdown. However, we can reasonably assume that, given the price action, speculators are even more aggressively long risk assets today than when the last COT data was released. Nevertheless, it is clear that large speculators (the green line in the chart below) are holding the largest net short position in history and have been for over two years. We have been expecting an unwind of this position that would force bonds higher and yields lower, but instead, we have mostly been in a holding pattern. However, that doesn’t mean the conclusion will be any different.
This feels like a good time to reshare a 25-year look at the 30-year Treasury bond futures chart. The most important takeaway from this chart is the fact that in 2020, investors flocked to the long bond in hopes of diversification from risk assets (namely stocks); everyone was doing it, so the crowd piled in. These securities were bought at yields of less than 1% at levels that posed substantial interest rate and capital risk, but the focus was on the return of capital rather than the return on capital. Imagine buying a 30-year security that merely returns your money at the end, plus an extra $700 per $100,000 invested annually. See the following chart to see how the bandwagon trade into long Treasuries paid off. Today’s market mentality is the exact opposite; buying a 30-year security yielding $4500 per year and the potential for capital gains is shunned because the crowd has its eye on double-digit gains in risk assets. This, too, shall pass.
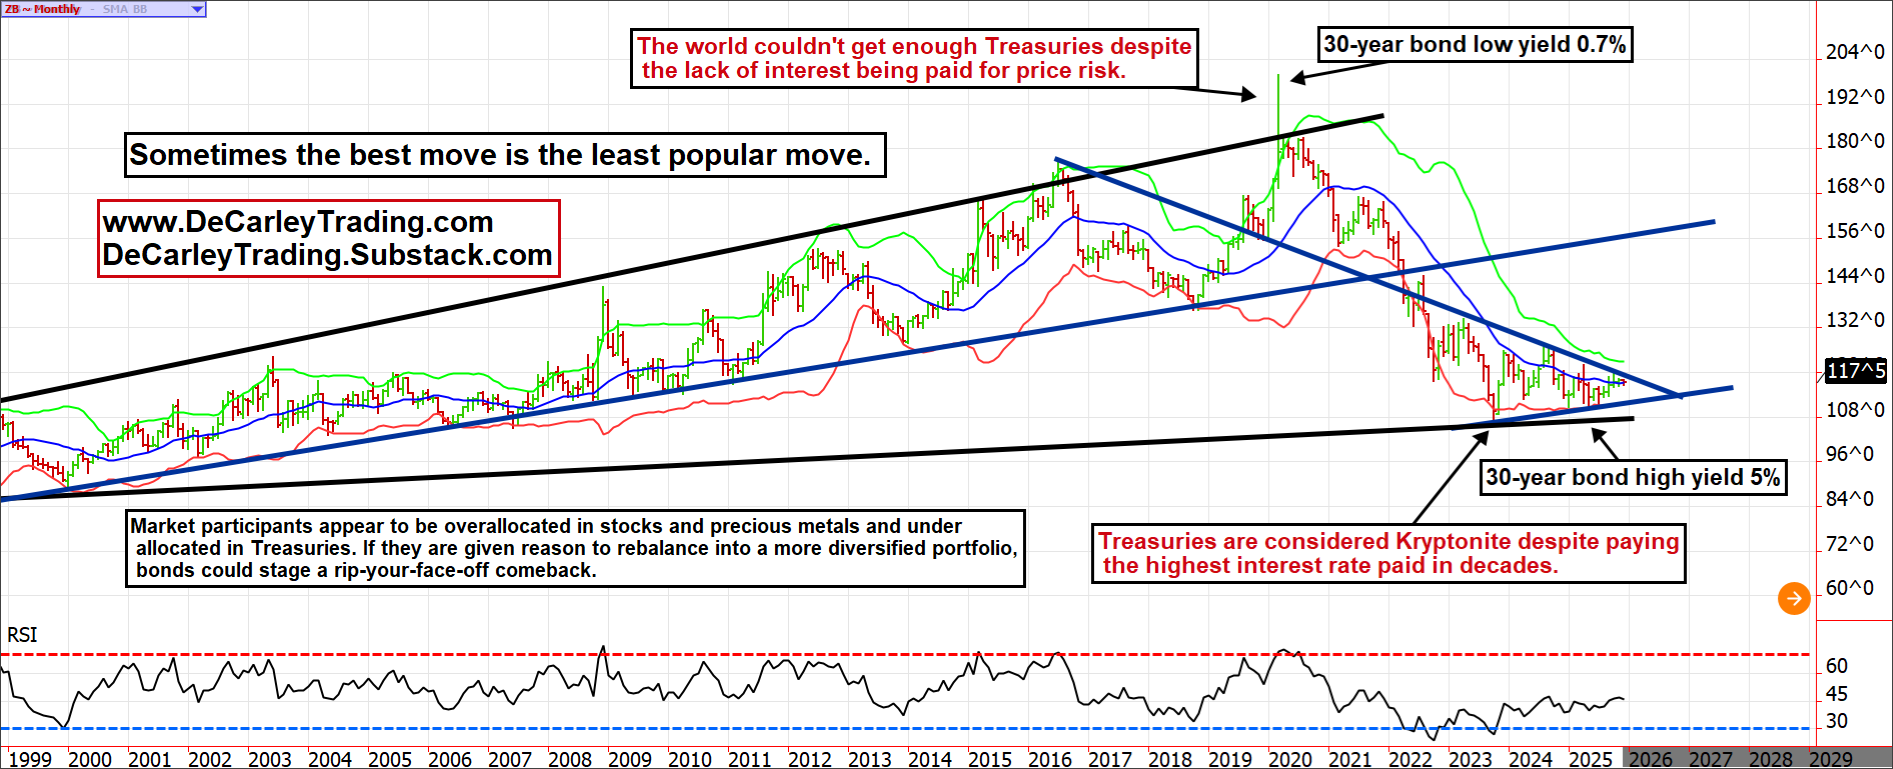
If you have been following us for any amount of time, you have already seen and heard this, but it is worth repeating. US Treasuries suffered a precipitous blow from their 2020 blow-off top through the capitulation-low forged in October of 2023. The spike in interest rates and plunge in bond valuations took a toll on investors' willingness to diversify with fixed-income products. Who could blame them? They were left holding the bag on securities with almost no yield. We have seen this before, in 2000, Treasuries were considered kryptonite following a brutal bear market. This led to a historically low allocation to bonds, much like we are seeing now. Contrary to conventional thinking and crowd investing, that would have been one of the best times in history to be a bondholder. Once the infamous dotcom bubble popped, investors realized they were holding more risk than they wanted and shuffled back into the bond market for diversification. Eventually, this cycle will end similarly as investors sell their stock, metals, and crypto to diversify into bonds. But we don’t know when the process starts or what the tipping point will be to turn the tide.
Treasury positioning is important because it creates a scenario in which investors have more money to allocate to riskier assets. In other words, if the 60/40 portfolio is now 90/10, or even 100% non-bond holdings, there is twice as much cash chasing the same seven stocks, the same two or three metals, and crypto.
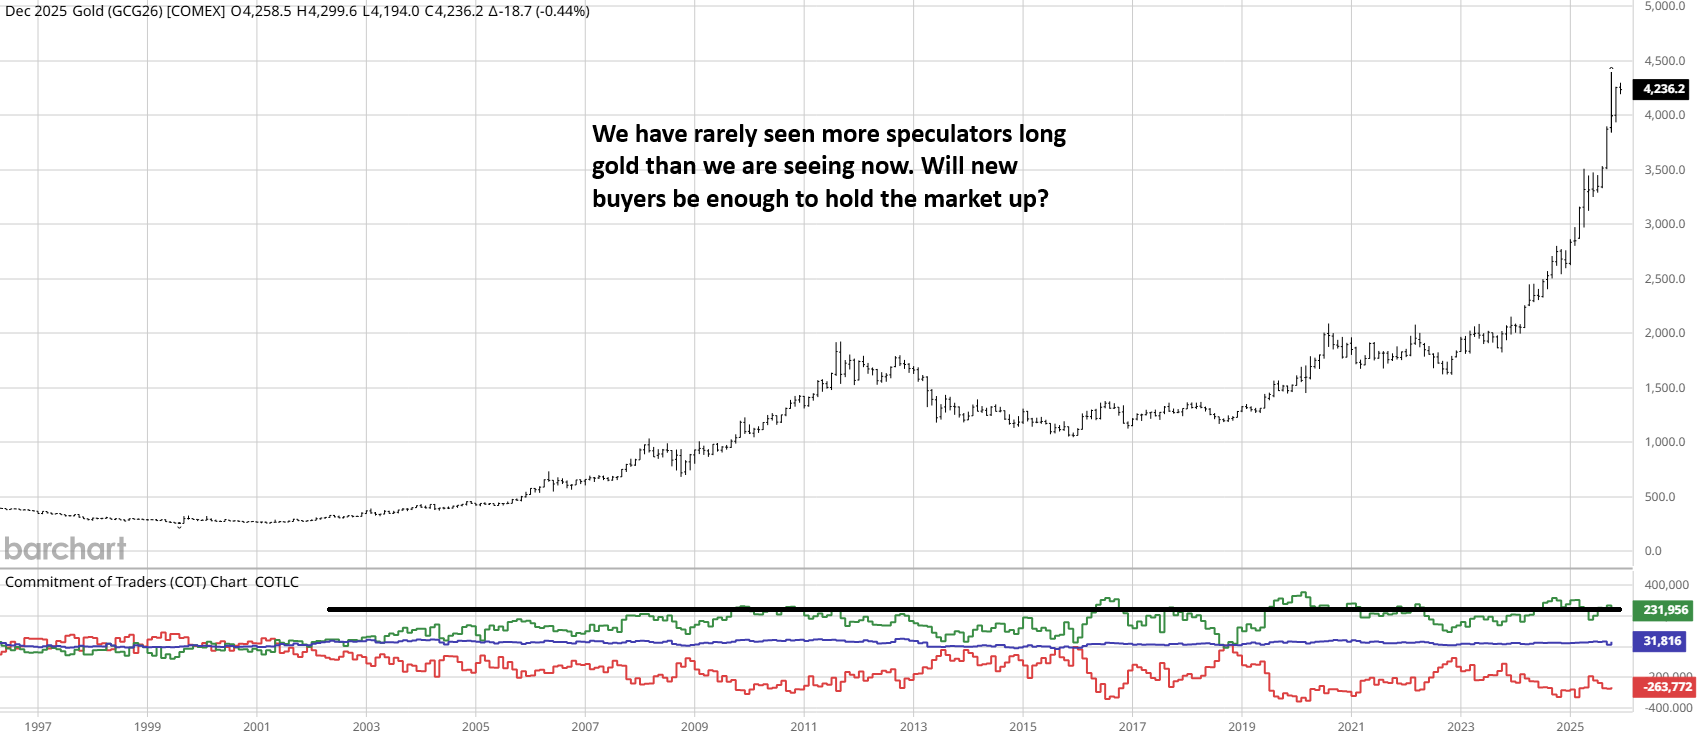
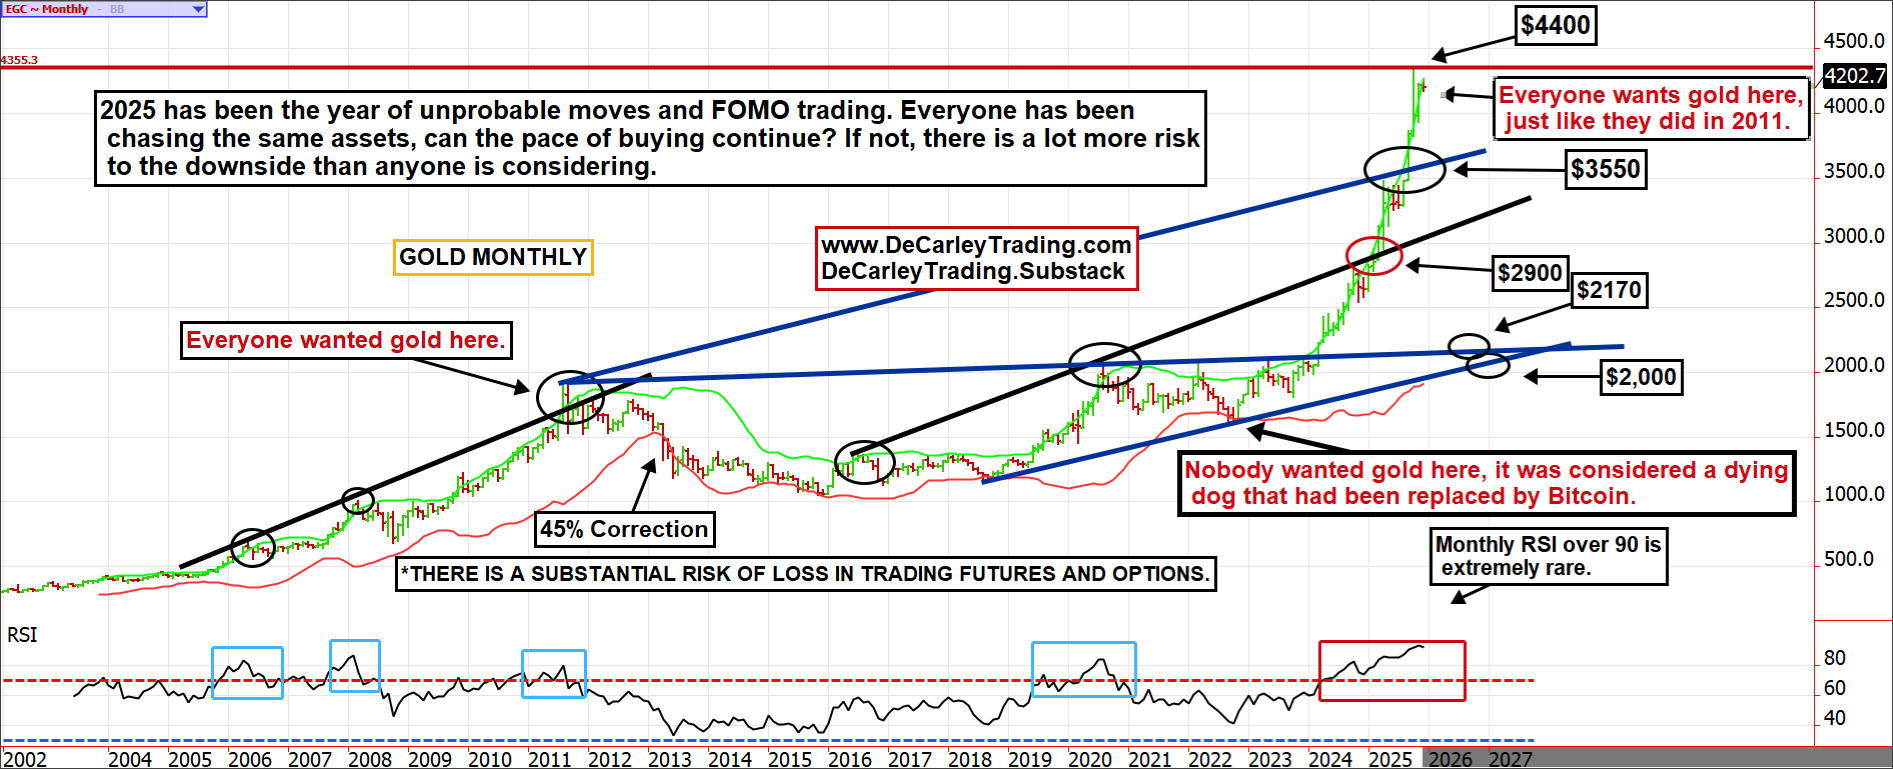
With that said, we would like to revisit an oldie but a goodie. We have shared this chart before in our newsletter and via some media outlets, including Mad Money with Jim Cramer. Of course, we have admitted that the gold chart misled us (we were wrong); we weren't counting on the market misbehaving as it hasn't since 1979, yet here we are. Nevertheless, allocating fresh money to the long side of gold at these levels might continue to work out, but the upside potential is minimal over the next 12 months relative to the downside risk. We have an inkling that the 2025 rush to gold for safety could end similarly to the 2020 rush to Treasuries. After all, gold pays no dividend and, at these levels, poses substantial downside risk, yet the crowds are aggressively buying more, just as we saw money flow into bonds at the end of the bull cycle.
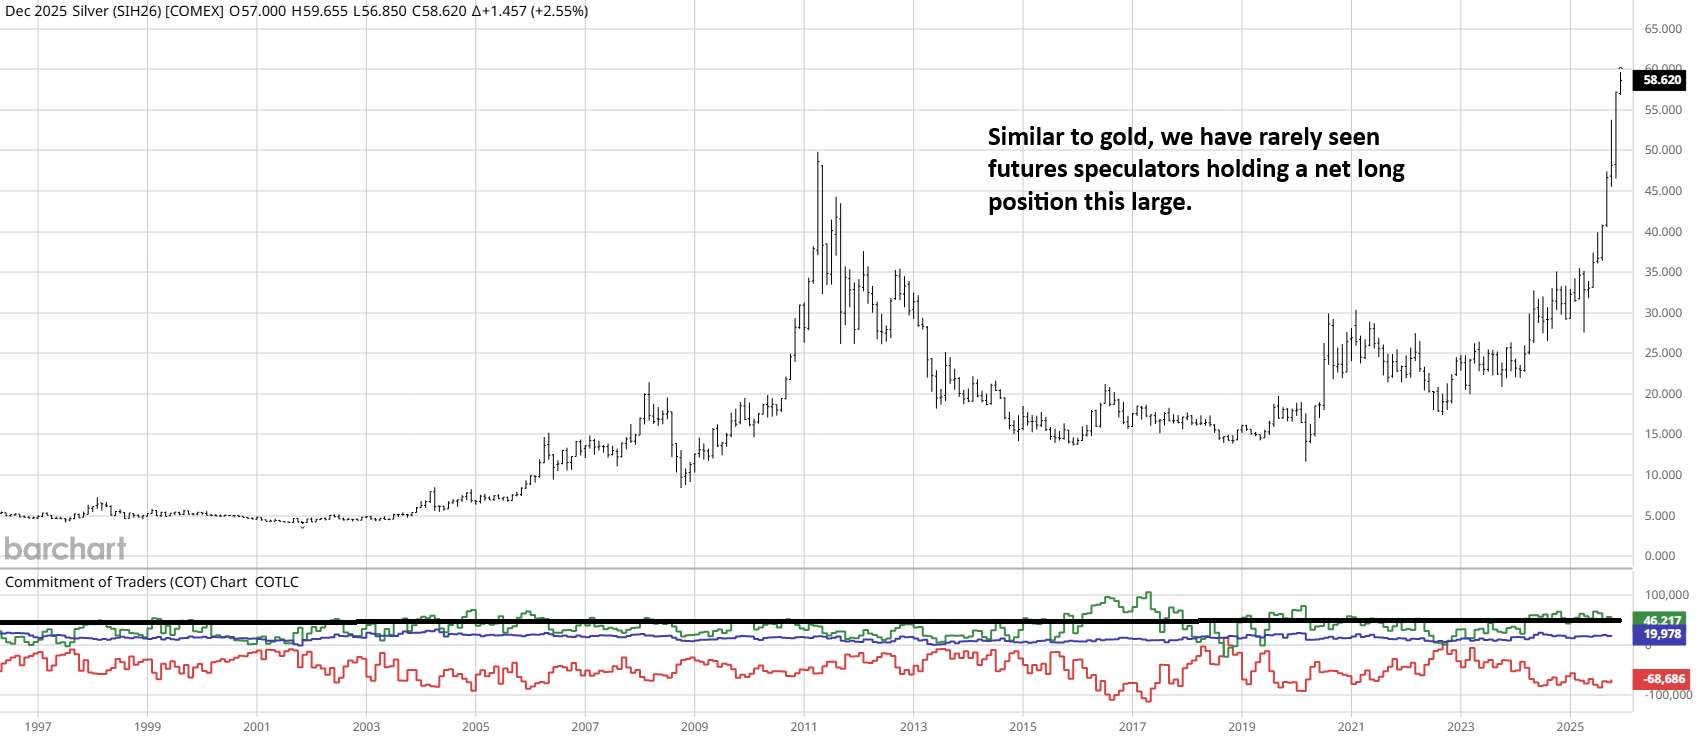
We rarely mention silver futures because it is a genuinely awful market for traders of all time frames. Intraday trading in silver is generally either flat or full of unmanageable volatility. There is very little in between. On a longer time frame, we have seen silver trade at $50.00 per ounce on three occasions in history, and both times resulted in unfathomable drawdowns spanning decades. The third rally, currently underway, has broken above $5.00 for the first time in history. Will this time be different, or are we knocking on the door of the next rug pull? With speculators as long as they have ever been, we might have a hard time finding enough fresh capital to keep the train on the track.
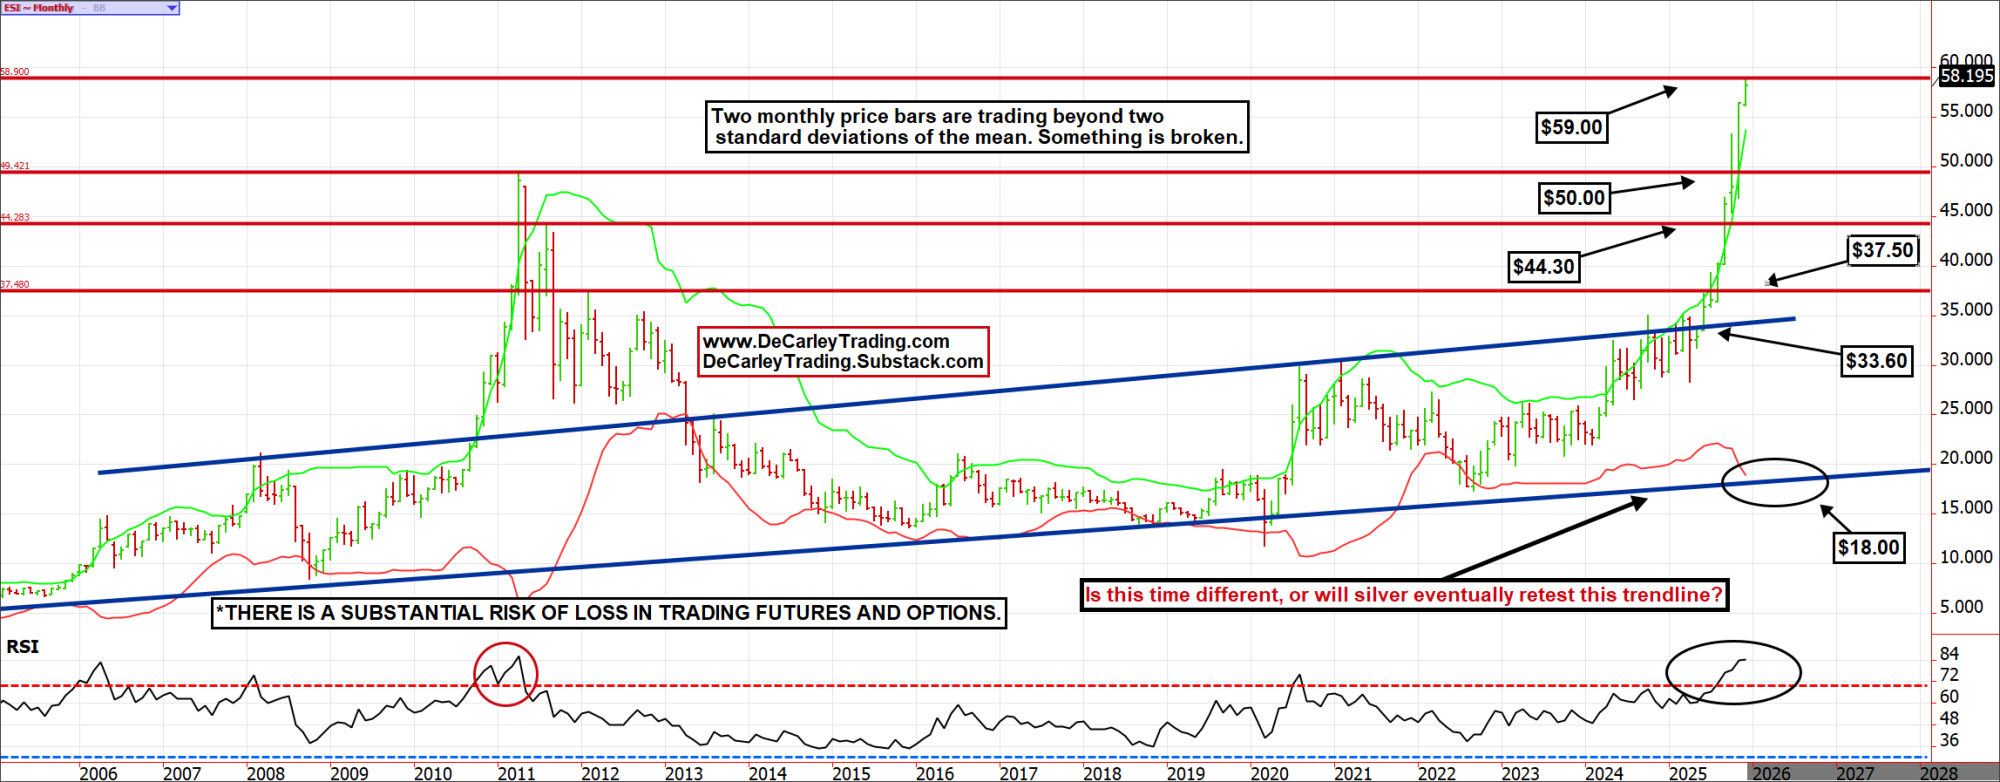
We have charted the natural and healthy trading range for silver based on historical probabilities; either the AI revolution or cracks in confidence in the traditional financial system have dramatically altered the market, or we will see silver return to this range between $18.00 and $34.00. It is extremely rare for a market to rally so sharply that two monthly price bars trade outside of the Upper Bollinger Bands. For perspective, markets generally remain within the bands (based on bell curve statistics) about 96% of the time. I’ve seen a handful of such moves in the past, but they are rare. I don’t recall ever seeing this type of off-the-rails rally sustaining gains. Commodities will always “commodity”.
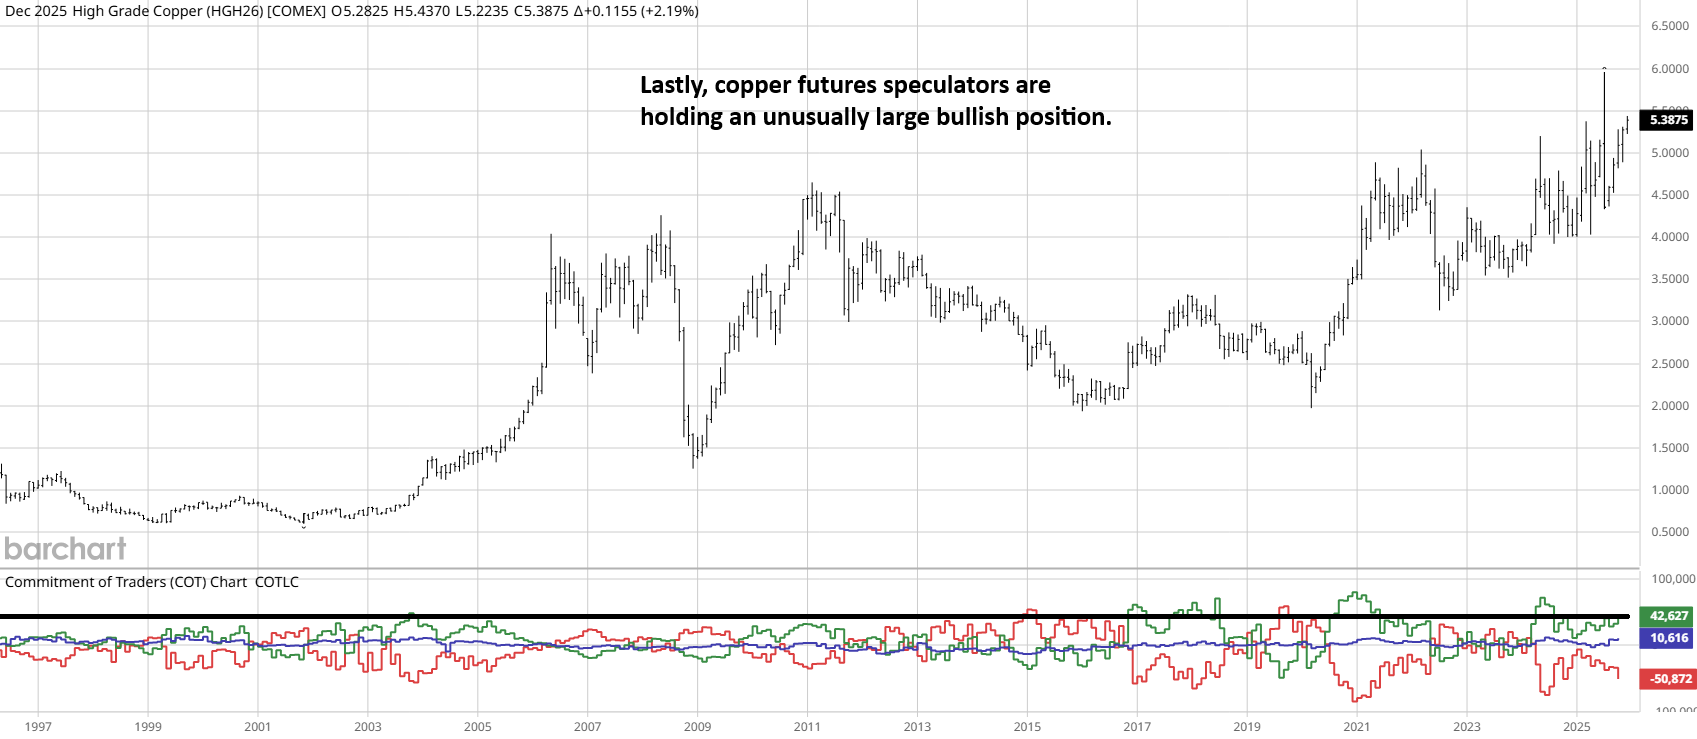
We don’t have a strong opinion on copper, but it is worth noting that speculators are holding historically large net long positions. So, it is probably safe to say that the same investor mentality is attracting money into copper as we are seeing in gold, silver, and tech stocks. In other words, it is one of the chosen assets, likely due to its ties to AI infrastructure manufacturing.
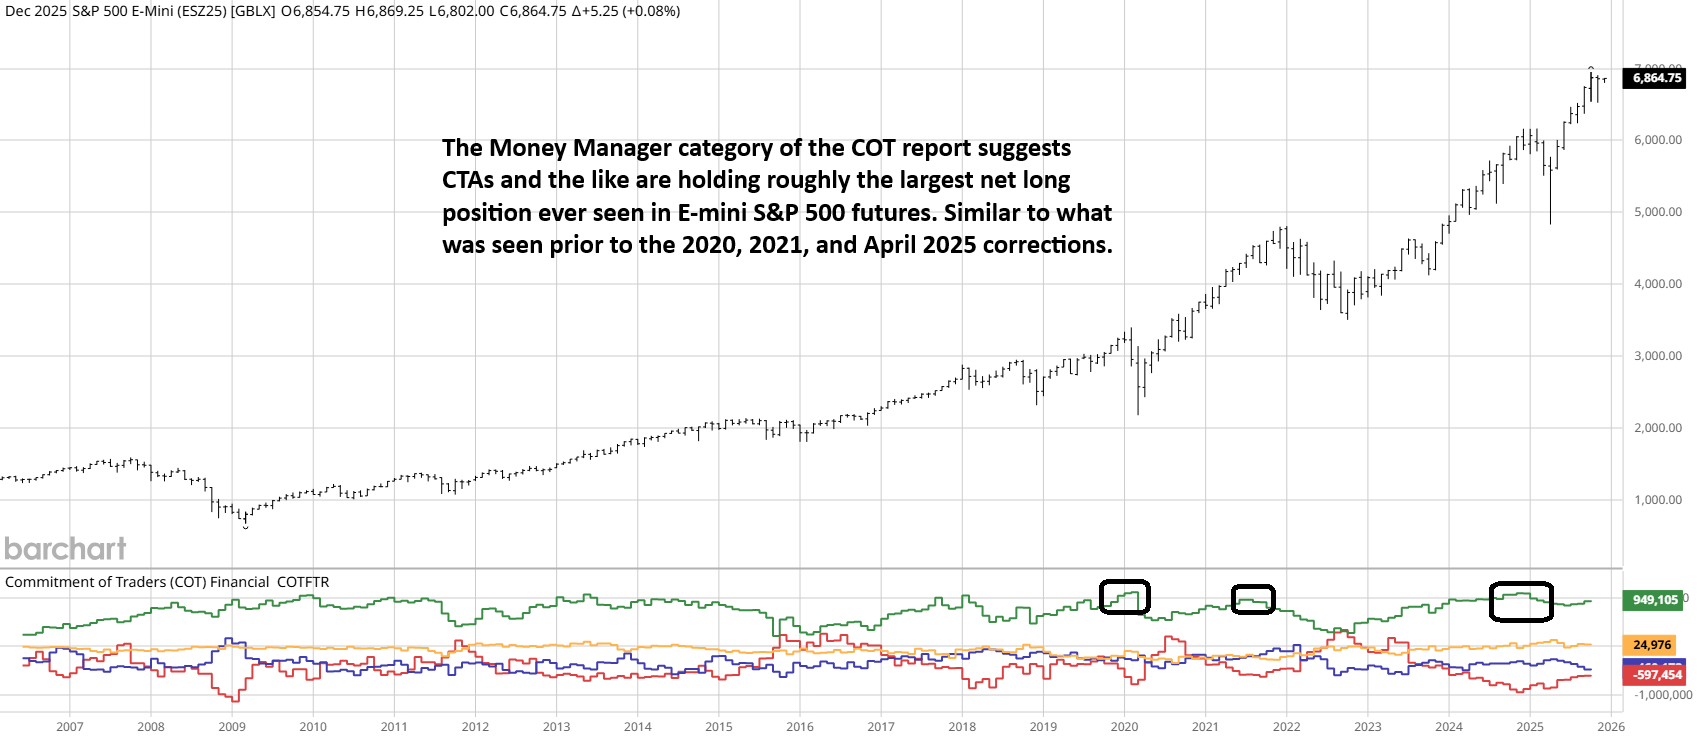
Investors are avoiding Treasuries but buying stocks like drunken sailors, and that has been working like a charm. But risk assets are labeled as such for a reason, and we suspect a day of reckoning could be around the corner. Mid-term election years are known for being tumultuous, and we have noticed the Managed Money category of the COT report suggests that CTA (Commodity Trading Advisors), hedge funds, and the like are holding one of the largest bullish positions in the E-mini S&P 500 on record. Sizable corrections followed previous occasions in 2020 and 2021. The problem with too many people being too long the market, is that eventually there will be a catalyst to cause them to sell. If they do it all at the same time, it can quickly get out of hand, as it did in March of 2020.
What’s the takeaway from all of this? In grade school, we were commonly asked, “If everyone else is jumping off a bridge, will you do so, too?” Of course, the answer was always “no”. I think we underappreciate the lesson that example taught. It is a good one. In life, and in trading or investing, it is comfortable to go with what everyone else is doing and, more importantly, what fits into the commonly accepted narrative of the day. This provides short-term gratification and a lack of friction that none of us wants to be a part of. Going with the flow in financial assets has, without a doubt, been a home run strategy in 2025. Those thinking with a contrarian mindset (guilty) have had a challenging (polite word) year.
Nevertheless, what we have seen in the last 12 to 16 months is far from normal. We are seeing some assets move more in a few days than they previously moved in stretches of years, not days or weeks. It is naïve to be complacent about the fact that volatility can go either way. Even worse, markets, without fail, take the stairs up and the escalator down. Accordingly, if you are long the right risk assets and smiling each time you check your portfolio, please make sure you protect the gains. This can be done by lightening up, hedging with options (we at DeCarley Trading can help you with that), or by trailing stop-loss orders. Market prices, cycles, and trends are always temporary. More so, what works in one year generally doesn’t work in the following year. 2025 broke that unwritten rule, but in general, the assets you see on the top of the performance list at the end of the year have a pretty good chance at being at the bottom of the list the following year.
*There is a substantial risk of loss in trading futures and options. There are no guarantees in speculation; most people lose money trading commodities. Past performance is not indicative of future results. Seasonality is already factored into current prices, any references to such does not infer certainty in future price action.
These recommendations are a solicitation for entering into derivatives transactions. All known news and events have already been factored into the price of the underlying derivatives discussed. From time to time persons affiliated with Zaner, or its associated companies, may have positions in recommended and other derivatives.
All rights reserved, DeCarley Trading.