
- PREMIUM
- LIVE QUOTES
- INSTITUTION
 Index Options
 State Street
 CME Group
 Nasdaq
 Cboe
Cboe TradingView
 Wall Street Journal
Is Copart Becoming Attractive After a 31% Slide in 2025?
- Wondering if Copart is starting to look like a bargain after its recent slide, or if the market is finally pricing it more realistically? Let us unpack what the current share price is really saying about the business behind the ticker.
- Copart shares now trade around $38.85, with a modest 0.3% gain over the past week but a sharp -9.7% move in the last month and a steep -31.0% YTD, contributing to a -38.3% 1 year return. Even so, the 3 year and 5 year returns of 23.2% and 36.2% remind us there is a longer term growth story beneath the near term volatility.
- Recently, the stock has been reacting to shifting sentiment around vehicle demand, salvage volumes, and used car pricing trends, as investors reinterpret what these industry dynamics mean for Copart's long term growth runway. Broader market rotations away from previously high multiple growth names toward more immediately "defensive" cash flows have also pressured the share price, even as Copart continues to invest in its global yard network and digital auction platform.
- Right now, Copart scores a 4/6 valuation check score, suggesting it screens as undervalued on most but not all of our standard metrics. Next we will dig into those individual valuation approaches, and then finish by looking at a more holistic way to judge whether the current price truly reflects Copart's long term economics.
Find out why Copart's -38.3% return over the last year is lagging behind its peers.
Approach 1: Copart Discounted Cash Flow (DCF) Analysis
A Discounted Cash Flow model estimates what a business is worth by projecting the cash it can generate in the future and discounting those cash flows back to today. For Copart, the model used is a 2 Stage Free Cash Flow to Equity approach, based on cash flow projections in $.
Copart generated about $1.30 billion in free cash flow over the last twelve months, and analysts expect this to rise steadily, with Simply Wall St extrapolating those estimates further out. Based on these assumptions, free cash flow is projected to reach roughly $2.41 billion by 2035 as the company continues to scale its global operations.
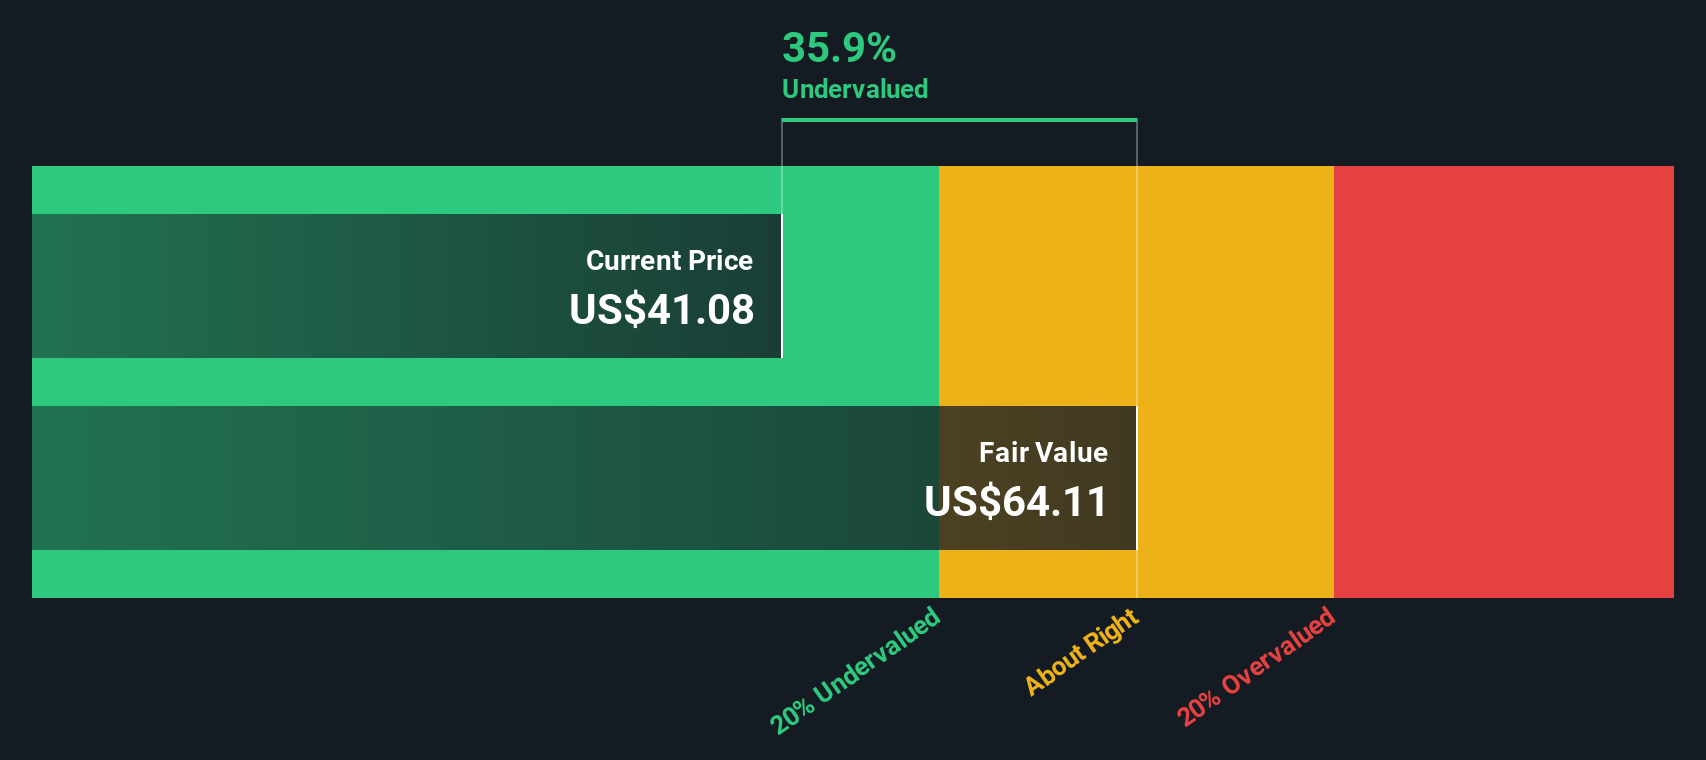
When all of those future cash flows are discounted back to today, the intrinsic value comes out at about $49.05 per share. Compared with the recent share price around $38.85, the DCF suggests Copart is trading at roughly a 20.8% discount, which indicates the market may not be fully pricing in its long term cash generation.
Result: UNDERVALUED
Our Discounted Cash Flow (DCF) analysis suggests Copart is undervalued by 20.8%. Track this in your watchlist or portfolio, or discover 915 more undervalued stocks based on cash flows.
Approach 2: Copart Price vs Earnings
For consistently profitable companies like Copart, the price to earnings, or PE, ratio is a useful yardstick because it directly links what investors pay today to the earnings the business is already generating. In general, faster growing and lower risk businesses are often associated with higher PE ratios, while slower or riskier companies tend to trade on lower multiples.
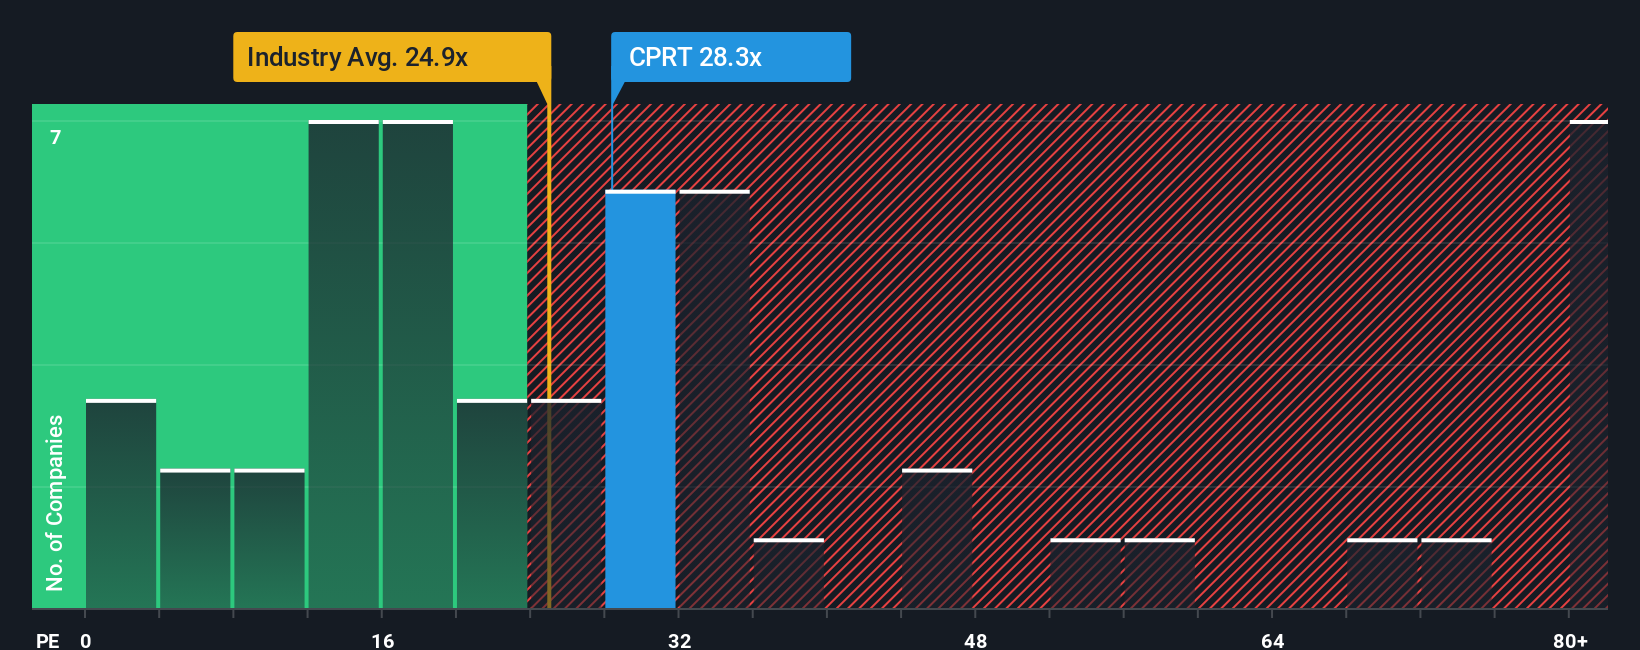
Copart currently trades on a PE of about 23.6x, which is slightly above the broader Commercial Services industry average of around 23.0x, but below the 34.5x average of its closer peers. To move beyond these blunt comparisons, Simply Wall St uses a proprietary Fair Ratio, which estimates the PE Copart might trade on given its earnings growth, profit margins, industry, market cap and risk profile. This Fair Ratio for Copart is 28.6x, suggesting the stock could warrant a higher multiple than it currently commands.
Because the Fair Ratio builds in company specific fundamentals rather than just copying what peers trade at, it offers a more tailored view of value. Comparing Copart’s current 23.6x PE to its 28.6x Fair Ratio indicates that the shares may appear undervalued on this metric.
Result: UNDERVALUED
PE ratios tell one story, but what if the real opportunity lies elsewhere? Discover 1443 companies where insiders are betting big on explosive growth.
Upgrade Your Decision Making: Choose your Copart Narrative
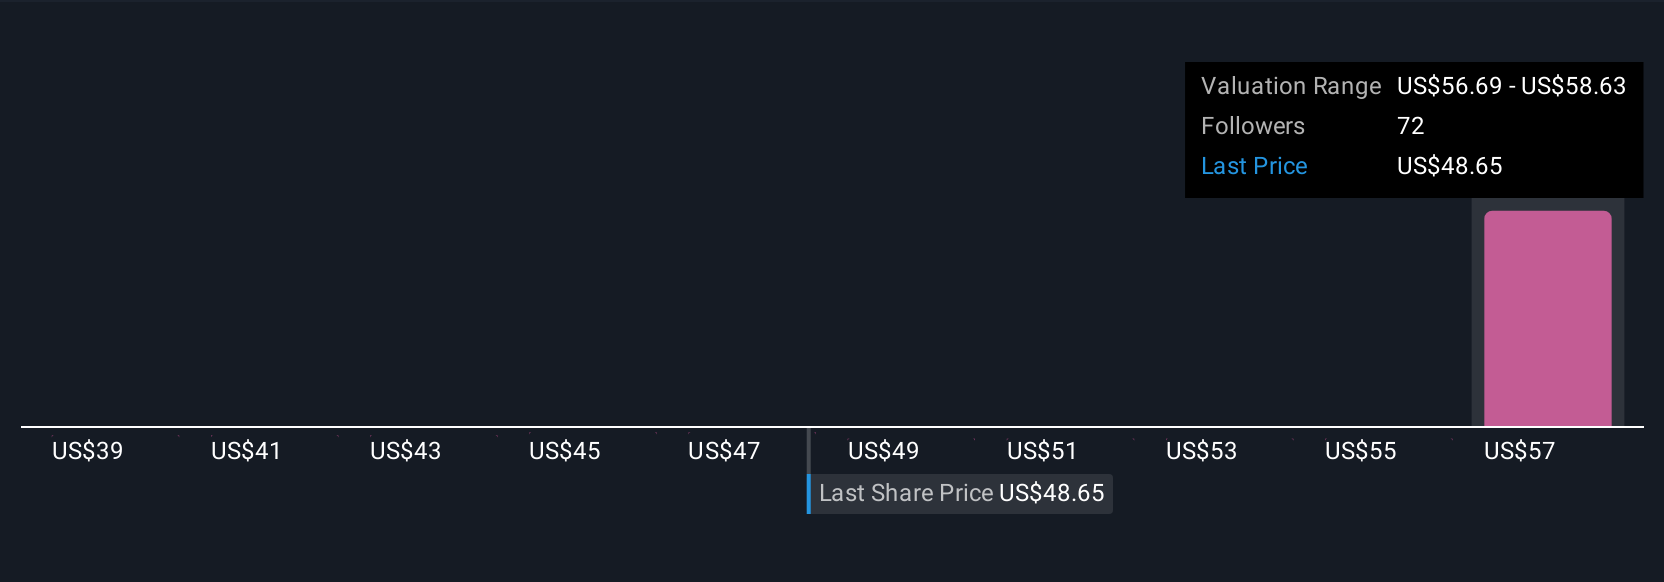
Earlier we mentioned that there is an even better way to understand valuation. Let us introduce you to Narratives, a simple tool on Simply Wall St’s Community page that lets you write the story behind your numbers by linking your view of Copart’s business, its future revenue, earnings and margins, to a concrete financial forecast and implied fair value. You can then compare this to today’s share price to decide whether it looks like a buy or a sell. The platform dynamically updates your Narrative as new information like earnings or news arrives. One bullish Copart investor might project international expansion, digital auction growth and share repurchases supporting a fair value closer to the recent analyst high of about $65. A more cautious investor, focused on insurance headwinds and competitive pressure, could reasonably anchor their Narrative nearer the low end around $46. This shows how different perspectives on the same company can coexist, each grounded in an explicit, testable forecast rather than a vague “it feels cheap” or “it looks expensive” judgment.
Do you think there's more to the story for Copart? Head over to our Community to see what others are saying!
This article by Simply Wall St is general in nature. We provide commentary based on historical data and analyst forecasts only using an unbiased methodology and our articles are not intended to be financial advice. It does not constitute a recommendation to buy or sell any stock, and does not take account of your objectives, or your financial situation. We aim to bring you long-term focused analysis driven by fundamental data. Note that our analysis may not factor in the latest price-sensitive company announcements or qualitative material. Simply Wall St has no position in any stocks mentioned.
Have feedback on this article? Concerned about the content? Get in touch with us directly. Alternatively, email editorial-team@simplywallst.com