
- PREMIUM
- LIVE QUOTES
- INSTITUTIONS
 Index Options
 State Street
 CME Group
 Nasdaq
 Cboe
Cboe TradingView
 Wall Street Journal
Has Atmos Energy’s 2025 Rally Already Priced In Its Defensive Growth Story?
- Wondering if Atmos Energy is still worth buying after its big run, or if most of the upside is already priced in? You are not alone. This stock has quietly become a favorite among defensive growth investors.
- The share price is up 23.8% year to date and 21.5% over the last year, even after a recent dip of 2.6% over the past week and a mild 0.9% slide across the last month.
- That momentum has been underpinned by ongoing regulatory approvals for infrastructure investments and a continued push to modernize its natural gas pipeline network, which investors often see as supporting long term, rate based growth. At the same time, broader market attention on essential service providers and the energy transition has put a spotlight on utilities like Atmos Energy as a relatively stable way to play a shifting energy landscape.
- Despite this strong multi year performance, Atmos Energy currently scores just 1/6 on our valuation checks, suggesting it only screens as undervalued on one metric. Next we will break down what different valuation approaches say about the stock, then finish with a more holistic way to think about its true long term value.
Atmos Energy scores just 1/6 on our valuation checks. See what other red flags we found in the full valuation breakdown.
Approach 1: Atmos Energy Dividend Discount Model (DDM) Analysis
The Dividend Discount Model estimates a company’s value by projecting its future dividends and discounting them back to today, assuming the stock is ultimately worth the present value of all those payouts.
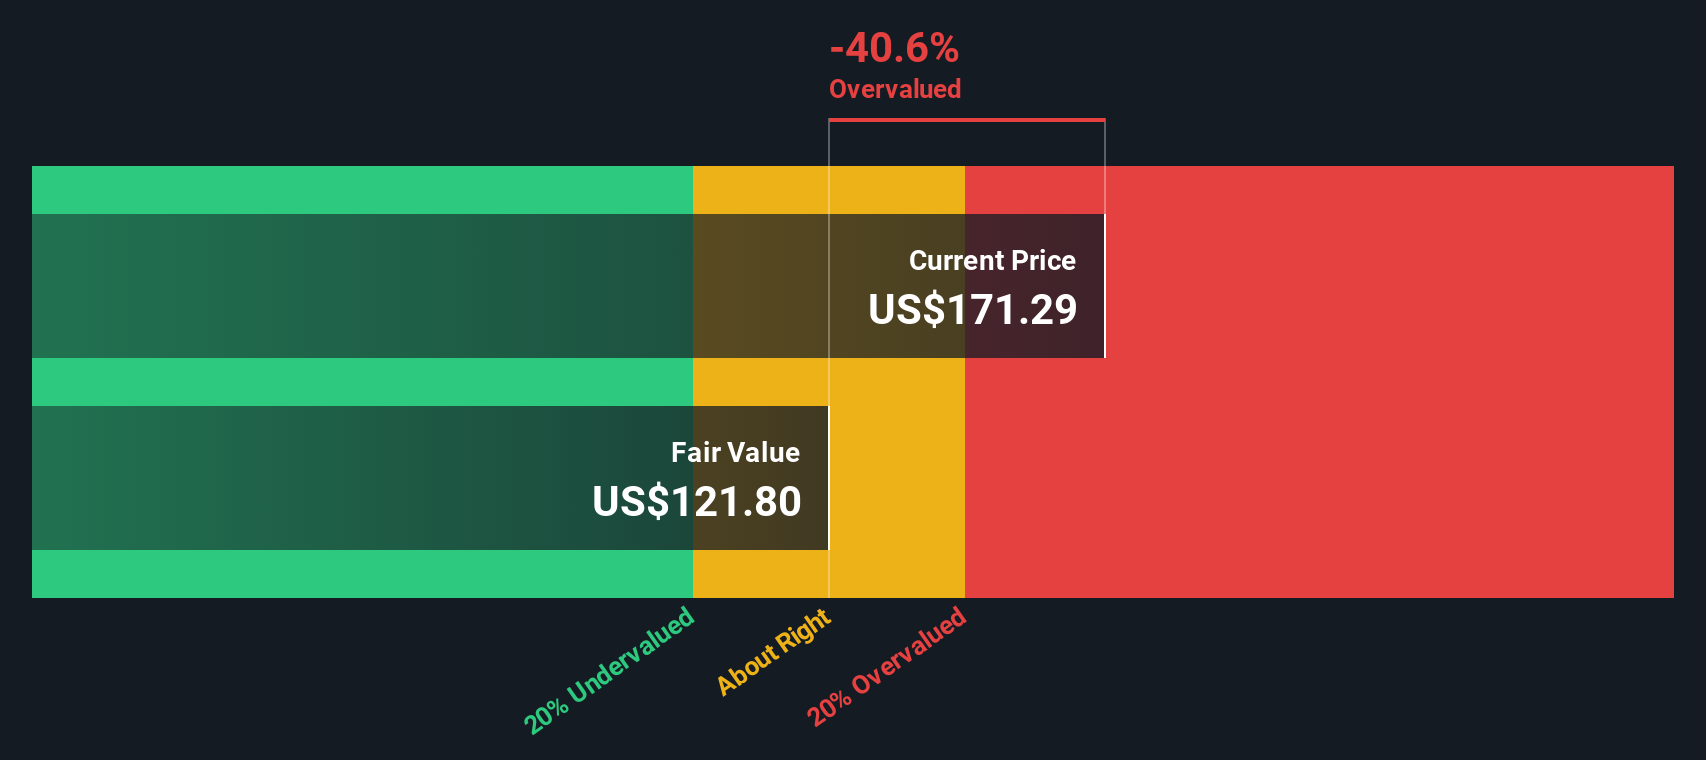
For Atmos Energy, the model starts with an annual dividend per share of about $4.50 and a return on equity near 9%. With a payout ratio around 47%, almost half of earnings are being returned to shareholders while the rest is reinvested to support future growth. Simply Wall St caps the long run dividend growth rate at 3.26%, slightly below the model’s raw expected growth of about 4.75%. This is a conservative way to avoid overstating future income streams.
Using these inputs, the DDM produces an intrinsic value of roughly $121.80 per share. That implies the stock is about 40.5% overvalued versus its current market price, suggesting investors are paying a rich premium for Atmos Energy’s stability and growth profile.
Result: OVERVALUED
Our Dividend Discount Model (DDM) analysis suggests Atmos Energy may be overvalued by 40.5%. Discover 915 undervalued stocks or create your own screener to find better value opportunities.
Approach 2: Atmos Energy Price vs Earnings
For a mature, consistently profitable utility like Atmos Energy, the price to earnings (PE) ratio is a practical way to gauge what investors are willing to pay today for each dollar of current earnings. In general, companies with faster, more reliable growth and lower perceived risk tend to justify higher PE ratios. Slower growth or higher uncertainty usually means a lower, more conservative multiple is appropriate.
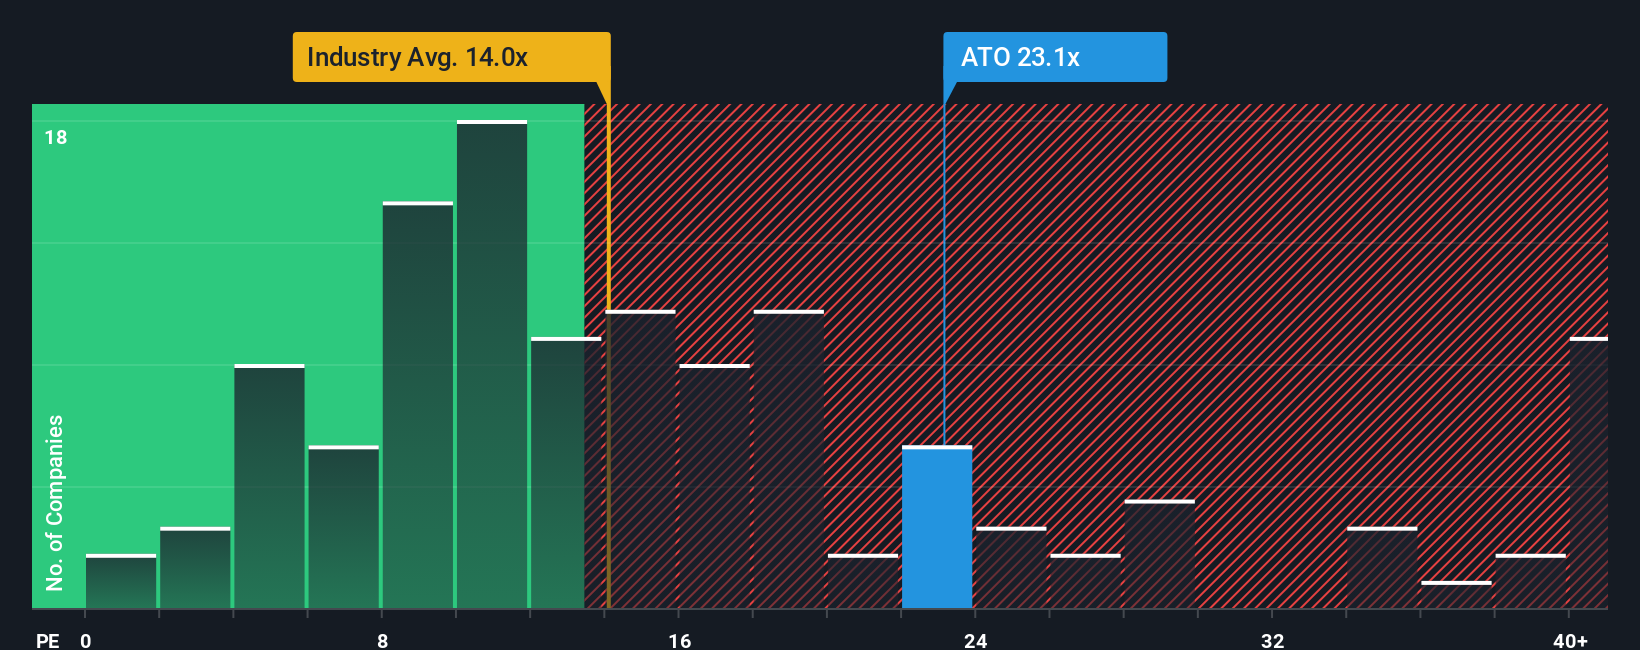
Atmos Energy currently trades on a PE of about 23.1x, well above both the Gas Utilities industry average of roughly 14.0x and the broader peer group average of around 17.4x. That premium suggests the market is already pricing in Atmos as a higher quality, lower risk, steadier growth utility than many of its peers.
Simply Wall St’s Fair Ratio framework goes a step further by estimating what PE multiple would be reasonable given Atmos Energy’s specific earnings growth outlook, profitability, industry positioning, market cap and risk profile. This holistic Fair Ratio comes out at about 23.5x, which is only slightly above the current 23.1x. That implies the market’s pricing is largely in line with the company’s fundamentals rather than clearly stretched or too conservative.
Result: ABOUT RIGHT
PE ratios tell one story, but what if the real opportunity lies elsewhere? Discover 1443 companies where insiders are betting big on explosive growth.
Upgrade Your Decision Making: Choose your Atmos Energy Narrative
Earlier we mentioned that there is an even better way to understand valuation, so let us introduce you to Narratives, an easy tool on Simply Wall St’s Community page that lets you turn your view of Atmos Energy into a clear story that links its business drivers to a financial forecast, and then to a Fair Value you can compare with today’s share price to help you decide how the stock looks right now.
In simple terms, a Narrative is you explaining why you think revenue, earnings and profit margins will move a certain way, then translating that into future cash flows, a reasonable PE multiple and, ultimately, the price you believe is fair. The platform then automatically updates that Fair Value as new news, guidance or earnings are released so your story stays current instead of going stale.
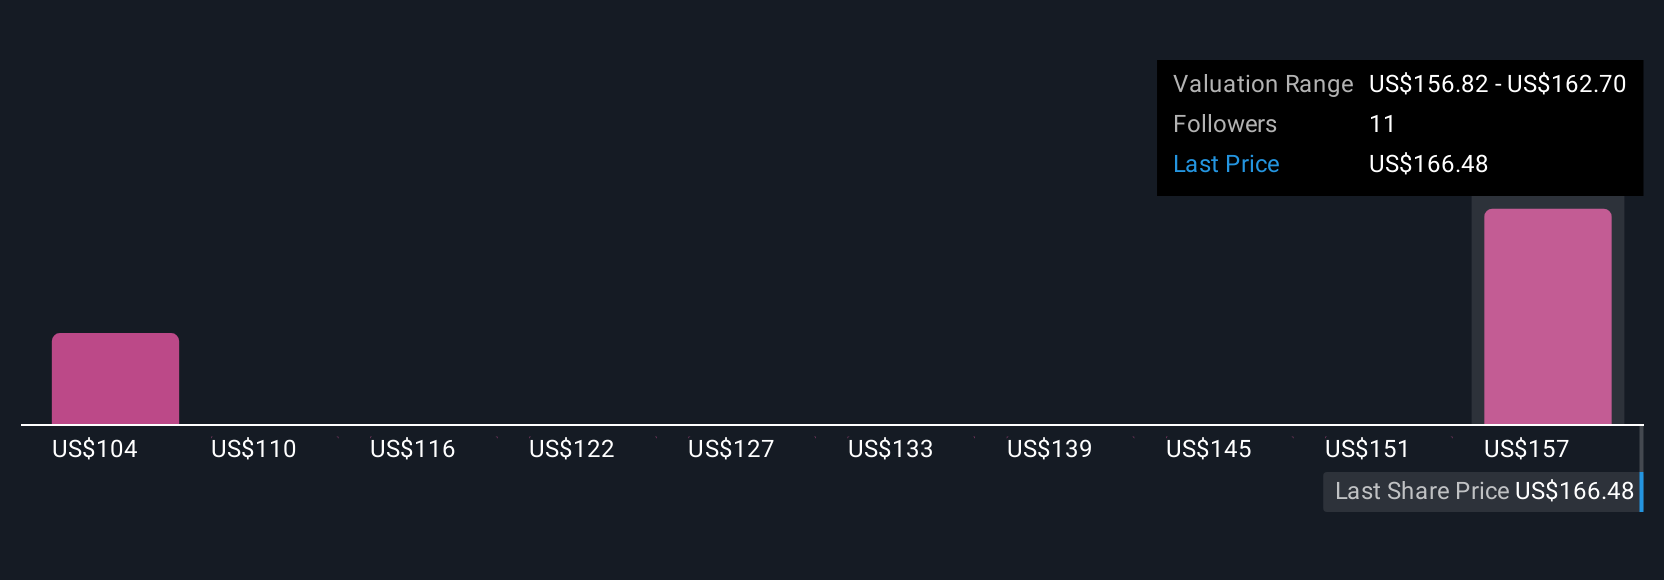
For example, one Atmos Energy Narrative might assume robust customer growth, constructive Texas regulation and steady margin expansion that supports a Fair Value closer to $182. A more cautious Narrative might focus on legal risks, rising capital and operating costs and long term electrification threats and land nearer $141, showing how different but reasonable perspectives can produce very different conclusions about whether the current market price offers enough potential upside.
Do you think there's more to the story for Atmos Energy? Head over to our Community to see what others are saying!
This article by Simply Wall St is general in nature. We provide commentary based on historical data and analyst forecasts only using an unbiased methodology and our articles are not intended to be financial advice. It does not constitute a recommendation to buy or sell any stock, and does not take account of your objectives, or your financial situation. We aim to bring you long-term focused analysis driven by fundamental data. Note that our analysis may not factor in the latest price-sensitive company announcements or qualitative material. Simply Wall St has no position in any stocks mentioned.
Have feedback on this article? Concerned about the content? Get in touch with us directly. Alternatively, email editorial-team@simplywallst.com