
- PREMIUM
- LIVE QUOTES
 Index Options
 State Street
 CME Group
 Nasdaq
 Cboe
Cboe TradingView
 Wall Street Journal
Assessing Meta Platforms's Performance Against Competitors In Interactive Media & Services Industry
In today's rapidly changing and highly competitive business world, it is imperative for investors and industry observers to carefully assess companies before making investment choices. In this article, we will undertake a comprehensive industry comparison, evaluating Meta Platforms (NASDAQ:META) vis-à-vis its key competitors in the Interactive Media & Services industry. Through a detailed analysis of important financial indicators, market standing, and growth potential, our goal is to provide valuable insights and highlight company's performance in the industry.
Meta Platforms Background
Meta is the largest social media company in the world, boasting close to 4 billion monthly active users worldwide. The firm's "Family of Apps," its core business, consists of Facebook, Instagram, Messenger, and WhatsApp. End users can leverage these applications for a variety of different purposes, from keeping in touch with friends to following celebrities and running digital businesses for free. Meta packages customer data, gleaned from its application ecosystem and sells ads to digital advertisers. While the firm has been investing heavily in its Reality Labs business, it remains a very small part of Meta's overall sales.
| Company | P/E | P/B | P/S | ROE | EBITDA (in billions) | Gross Profit (in billions) | Revenue Growth |
|---|---|---|---|---|---|---|---|
| Meta Platforms Inc | 28.30 | 8.31 | 8.73 | 1.39% | $26.85 | $42.04 | 26.25% |
| Alphabet Inc | 31.55 | 9.97 | 10.17 | 9.33% | $49.74 | $60.98 | 15.95% |
| Reddit Inc | 101.77 | 16.03 | 22.69 | 6.51% | $0.14 | $0.53 | 67.91% |
| Baidu Inc | 10.64 | 1.08 | 2.16 | -4.16% | $-12.51 | $12.86 | -7.1% |
| Pinterest Inc | 9.62 | 3.84 | 4.67 | 1.91% | $0.07 | $0.84 | 16.79% |
| Bilibili Inc | 99.07 | 4.95 | 2.60 | 3.24% | $0.5 | $2.82 | 5.2% |
| CarGurus Inc | 24.34 | 9.16 | 4.04 | 11.03% | $0.06 | $0.21 | 3.17% |
| ZoomInfo Technologies Inc | 32.48 | 2.05 | 2.70 | 2.51% | $0.09 | $0.27 | 4.74% |
| Weibo Corp | 5.91 | 0.66 | 1.59 | 5.93% | $0.12 | $0.34 | -4.77% |
| Yelp Inc | 13.45 | 2.53 | 1.37 | 5.32% | $0.07 | $0.34 | 4.36% |
| Tripadvisor Inc | 25.45 | 2.53 | 1.10 | 7.95% | $0.1 | $0.51 | 3.95% |
| Ziff Davis Inc | 13.95 | 0.79 | 1.03 | -0.2% | $0.07 | $0.31 | 2.87% |
| Taboola.com Ltd | 50.25 | 1.27 | 0.69 | 0.57% | $0.03 | $0.14 | 14.72% |
| Yalla Group Ltd | 8.63 | 1.42 | 3.68 | 5.38% | $0.03 | $0.06 | 0.8% |
| Hello Group Inc | 10.35 | 0.72 | 0.83 | -1.28% | $0.53 | $1.01 | -2.64% |
| Average | 31.25 | 4.07 | 4.24 | 3.86% | $2.79 | $5.8 | 9.0% |
By closely studying Meta Platforms, we can observe the following trends:
With a Price to Earnings ratio of 28.3, which is 0.91x less than the industry average, the stock shows potential for growth at a reasonable price, making it an interesting consideration for market participants.
It could be trading at a premium in relation to its book value, as indicated by its Price to Book ratio of 8.31 which exceeds the industry average by 2.04x.
The Price to Sales ratio of 8.73, which is 2.06x the industry average, suggests the stock could potentially be overvalued in relation to its sales performance compared to its peers.
With a Return on Equity (ROE) of 1.39% that is 2.47% below the industry average, it appears that the company exhibits potential inefficiency in utilizing equity to generate profits.
The company exhibits higher Earnings Before Interest, Taxes, Depreciation, and Amortization (EBITDA) of $26.85 Billion, which is 9.62x above the industry average, implying stronger profitability and robust cash flow generation.
With higher gross profit of $42.04 Billion, which indicates 7.25x above the industry average, the company demonstrates stronger profitability and higher earnings from its core operations.
The company's revenue growth of 26.25% is notably higher compared to the industry average of 9.0%, showcasing exceptional sales performance and strong demand for its products or services.
Debt To Equity Ratio
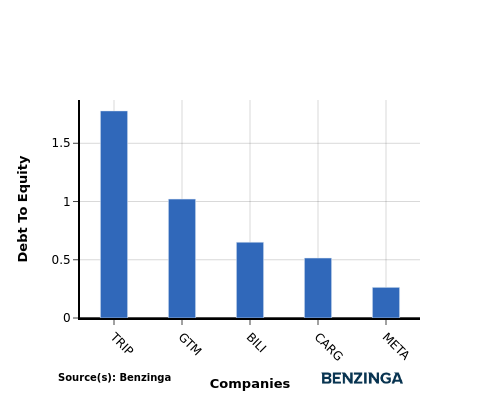
The debt-to-equity (D/E) ratio provides insights into the proportion of debt a company has in relation to its equity and asset value.
Considering the debt-to-equity ratio in industry comparisons allows for a concise evaluation of a company's financial health and risk profile, aiding in informed decision-making.
In terms of the Debt-to-Equity ratio, Meta Platforms can be assessed by comparing it to its top 4 peers, resulting in the following observations:
Meta Platforms demonstrates a stronger financial position compared to its top 4 peers in the sector.
With a lower debt-to-equity ratio of 0.26, the company relies less on debt financing and maintains a healthier balance between debt and equity, which can be viewed positively by investors.
Key Takeaways
The PE, PB, and PS ratios for Meta Platforms indicate that it may be undervalued compared to its peers in the Interactive Media & Services industry. However, the low ROE suggests that the company is not generating significant returns on equity. On the other hand, the high EBITDA, gross profit, and revenue growth highlight the company's strong operational performance and growth potential within the industry sector.
This article was generated by Benzinga's automated content engine and reviewed by an editor.