
- PREMIUM
- LIVE QUOTES
 Index Options
 State Street
 CME Group
 Nasdaq
 Cboe
Cboe TradingView
 Wall Street Journal
Is It Too Late to Consider Infineon After Recent Share Price Gains?
- Wondering if Infineon Technologies is still a smart buy at today’s price, or if most of the upside is already baked in? Let us unpack what the market might be missing in the valuation.
- The stock has climbed 5.6% over the last week, 6.2% over the past month, and is up 17.0% year to date, which suggests investors are steadily pricing in stronger prospects and possibly a higher tolerance for risk.
- Recently, the narrative around Infineon has been shaped by growing interest in power semiconductors and automotive chips as key enablers of EVs and energy transition, along with broader optimism around AI related infrastructure demand. At the same time, headlines about cyclical softness in parts of the chip industry are keeping expectations in check, creating a tug of war between long term structural growth and near term caution.
- On our framework, Infineon scores only 2 out of 6 on undervaluation checks. This means some signals point to value while others look more fully priced. Next we will break down what each valuation approach is really telling us, and later explore a more holistic way to judge whether the stock is genuinely attractive.
Infineon Technologies scores just 2/6 on our valuation checks. See what other red flags we found in the full valuation breakdown.
Approach 1: Infineon Technologies Discounted Cash Flow (DCF) Analysis
A Discounted Cash Flow model estimates what a company is worth by projecting the cash it can generate in the future, then discounting those cash flows back to today in € terms.
Infineon Technologies currently generates about €724.6 Million in free cash flow. Analysts cited in this model expect this to rise meaningfully over time as demand for power and automotive semiconductors grows. Based on these forecasts for the next few years and extrapolated estimates beyond that, free cash flow is projected in the model to reach roughly €4.5 Billion by 2030, with further growth into the next decade.
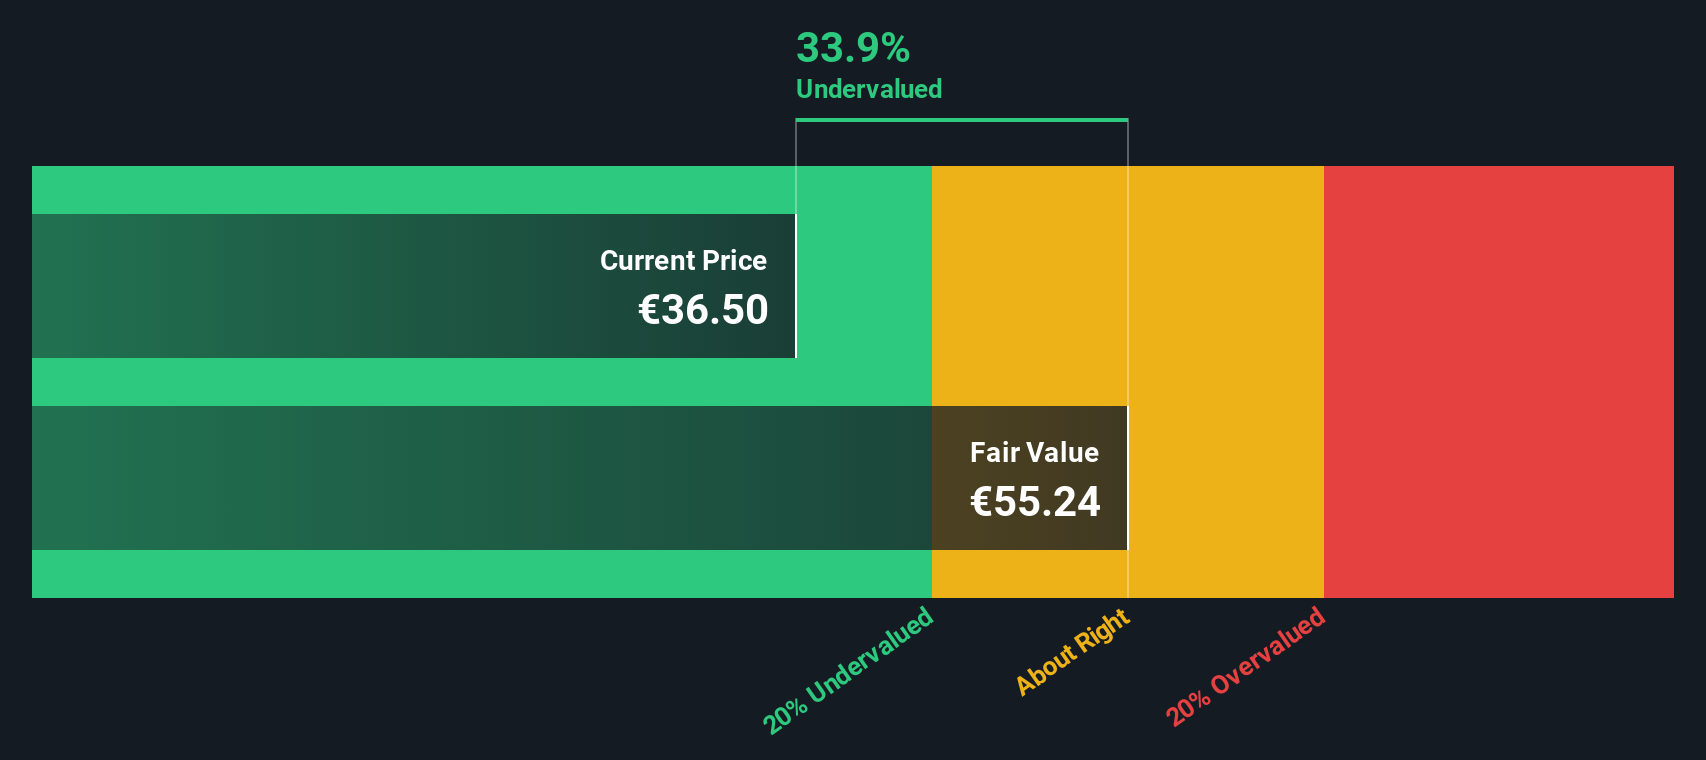
Using a 2 Stage Free Cash Flow to Equity model on these projections, Simply Wall St estimates an intrinsic value of about €55.17 per share. This implies the stock is trading at roughly a 33.4% discount to its assessed fair value, which suggests the market is still cautious about how durable this growth will be.
On balance, this DCF view indicates that Infineon shares appear attractively priced relative to their long term cash generation potential used in the model.
Result: UNDERVALUED
Our Discounted Cash Flow (DCF) analysis suggests Infineon Technologies is undervalued by 33.4%. Track this in your watchlist or portfolio, or discover 916 more undervalued stocks based on cash flows.
Approach 2: Infineon Technologies Price vs Earnings
For profitable companies like Infineon Technologies, the price to earnings, or PE, ratio is a useful way to gauge how much investors are paying for each euro of current earnings. A higher PE can be justified when investors expect faster growth or see the business as relatively low risk, while slower growth or higher uncertainty usually warrants a lower, more conservative multiple.
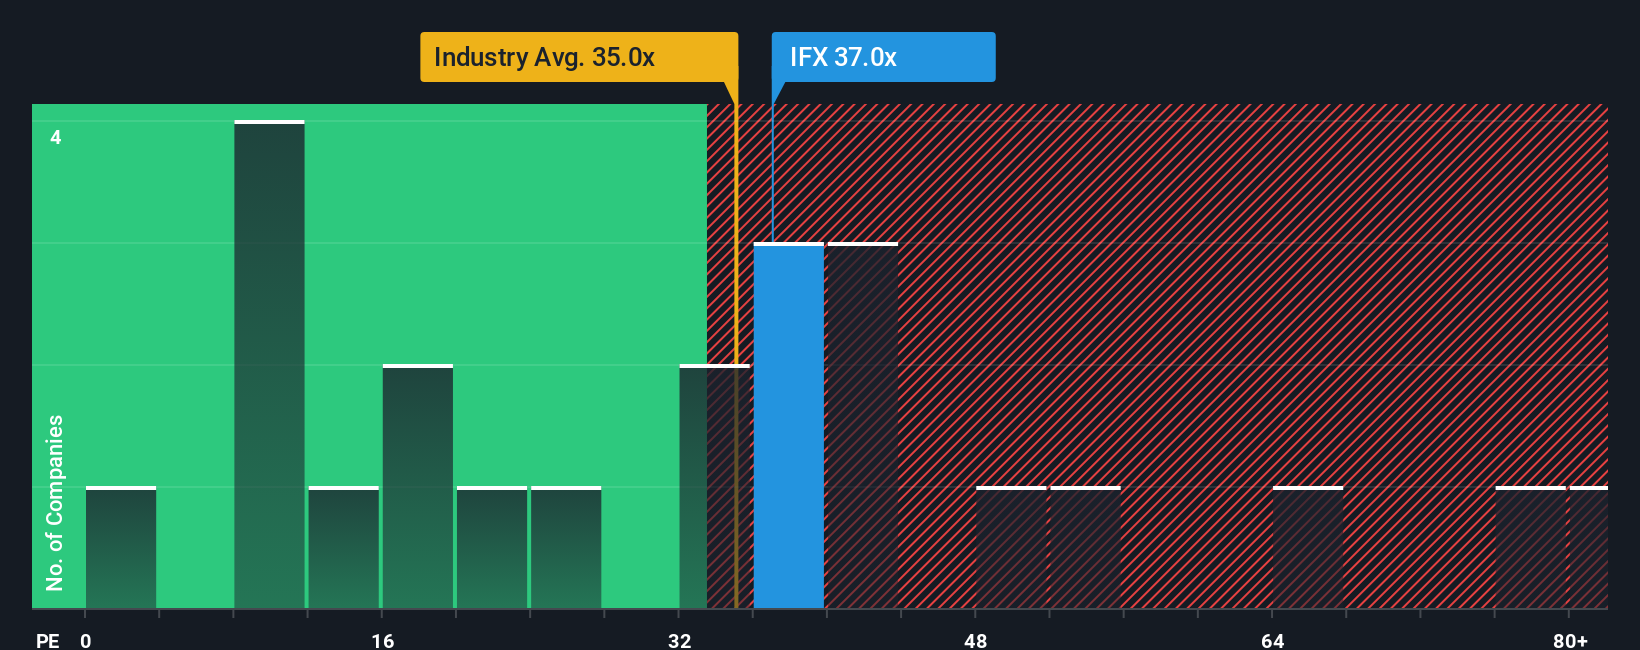
Infineon currently trades on a PE of about 48.5x, well above both the Semiconductor industry average of roughly 34.5x and the peer group average near 22.3x. On the surface, that suggests the market is already paying a premium for its earnings profile. Simply Wall St’s Fair Ratio for Infineon, however, is about 29.9x. This is their proprietary estimate of what a reasonable PE should be once you factor in the company’s growth outlook, profitability, industry positioning, market cap and risk profile.
Because the Fair Ratio is tailored to Infineon’s fundamentals rather than broad group averages, it is a more nuanced benchmark. Comparing the current 48.5x PE with the 29.9x Fair Ratio indicates the shares are pricing in more optimism than this framework would support.
Result: OVERVALUED
PE ratios tell one story, but what if the real opportunity lies elsewhere? Discover 1443 companies where insiders are betting big on explosive growth.
Upgrade Your Decision Making: Choose your Infineon Technologies Narrative
Earlier we mentioned that there is an even better way to understand valuation, so let us introduce you to Narratives, a simple framework where you write the story behind a company, link it to your assumptions for future revenue, earnings and margins, and then see what fair value those assumptions imply.
A Narrative on Simply Wall St connects three things: the business story you believe in, the financial forecasts that flow from that story, and the fair value that falls out of those forecasts, all in one place on the Community page that millions of investors use.
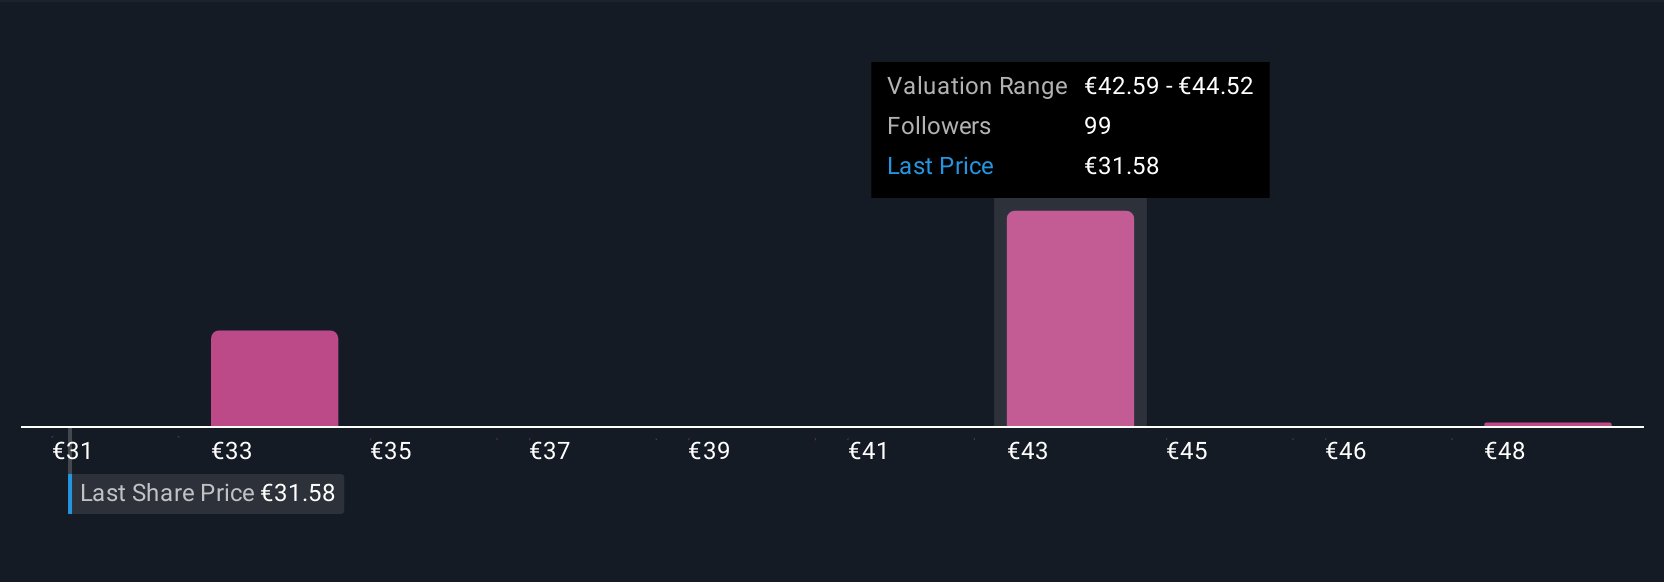
By comparing the Narrative fair value to the current share price, you can quickly see whether your story suggests Infineon is attractive, fairly priced, or unattractive at the current level. Because Narratives update dynamically when fresh news or earnings arrive, your view stays responsive instead of static.
For example, one Infineon Narrative might lean on strong AI data center and renewable energy demand to justify a fair value near €50 per share, while a more cautious Narrative, focused on geopolitical risk, EV softness and inventory concerns, might land closer to €37 and suggest waiting for a better entry price.
Do you think there's more to the story for Infineon Technologies? Head over to our Community to see what others are saying!
This article by Simply Wall St is general in nature. We provide commentary based on historical data and analyst forecasts only using an unbiased methodology and our articles are not intended to be financial advice. It does not constitute a recommendation to buy or sell any stock, and does not take account of your objectives, or your financial situation. We aim to bring you long-term focused analysis driven by fundamental data. Note that our analysis may not factor in the latest price-sensitive company announcements or qualitative material. Simply Wall St has no position in any stocks mentioned.
Have feedback on this article? Concerned about the content? Get in touch with us directly. Alternatively, email editorial-team@simplywallst.com